Constructing a Model from Literature-Based Parameters
Managing a Progressive Disease
Learning Objectives
By the end of this activity, you will be able to:
- Construct rate matrices from literature-based parameters
- Convert rate matrices to transition probability matrices for discrete-time Markov models
- Incorporate intervention effects expressed in different scales (hazard ratios, relative risks, odds ratios) into model structures
- Compare outcomes across different policy strategies
1. Introduction to the Decision Problem
This exercise will explore modeling a hypothetical but realistic progressive disease that follows a common chronic condition progression pattern:
- Initially asymptomatic.
- Progression to symptomatic disease over time.
- Increased mortality once disease has progressed.
- Potentially modifiable through various interventions (prevention, treatment, cure).
This disease structure applies to many real-world conditions such as certain cancers and progressive metabolic diseases.
Health States
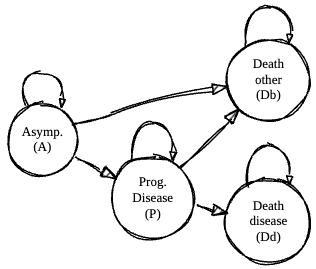
Our Markov model includes four mutually exclusive, collectively exhaustive health states:
- Asymptomatic (A): Patients have the underlying condition but experience no symptoms or functional limitations.
- Progressive disease (P): Patients have developed symptoms and experience disease-related morbidity.
- Death from disease (Dd): Mortality directly attributable to the progressive disease.
- Death from background causes (Db): Mortality from causes unrelated to the progressive disease.
The following state transitions are possible:
- A P: Development of progressive disease
- A Db: Death from background causes while asymptomatic
- P Dd: Death attributable to progressive disease
- P Db: Death from background causes while having progressive disease.
Eventually we will allow for a cure strategy that moves people back to the asymptomatic state from the progressive disease state: (i.e., P A).
Finally, we will adopt a one-year time cycle for this model.
Natural History Model Parameters
We will begin by parameterizing a Markov cohort model with the following:
- Progressive disease incidence rate (
r_AP): 0.4 over 10 years - Background mortality rate (
r_Db): 0.006 per year - Hazard rate of death from progressive disease relative to background mortality (
HR_PDd): 3.0 - One-year time cycle (“time step”).
These parameters represent the baseline disease progression without further intervention.
Note that parameters are expressed in different metrics (10-year rates, annual rates, hazard ratios)—a common challenge when working with literature-based inputs! You will need to convert these to the appropriate time step (1-year) in the model.
The parameters for the natural history and strategy-specific models are summarized in the table below.
| Parameter | Description | Value |
|---|---|---|
r_AP |
10-year progressive disease incidence rate | 0.40 |
r_Db |
Background mortality rate | 0.006 |
HR_PDd |
Hazard rate of death from progressive disease relative to background mortality | 3.0 |
Delta_t |
Cycle length | 1.0 |
Parameter Domains
In creating your transition matrices, keep in mind the following guidelines for how parameters may enter:
| Statistic | Evaluates | Range | Applicable Domain |
|---|---|---|---|
| Rate | \(\frac{\# \text{events in time period}}{\text{Total time period experienced by all subjects followed}}\) | 0 to \(\infty\) | Rate matrix |
| Hazard Ratio | \(\frac{\text{Hazard rate of outcome in exposed}}{\text{Hazard rate of outcome in unexposed}}\) | 0 to \(\infty\) | Rate matrix |
| Probability/risk | \(\frac{\# \text{events in time period}}{\# \text{people followed for time period}}\) | 0-1 | Probability matrix |
| Odds | \(\frac{\text{Probability of Outcome}}{1 - \text{Probability of Outcome}}\) | 0 to \(\infty\) | Probability matrix |
| Odds Ratio | \(\frac{\text{Odds of outcome in exposed}}{\text{Odds of outcome in unexposed}}\) | 0 to \(\infty\) | Probability matrix |
| Relative Risk | \(\frac{\text{Probability of outcome in exposed}}{\text{Probablity of outcome in unexposed}}\) | 0 to \(\infty\) | Probability matrix |
| Risk Difference | \(\text{Probability of outcome in exposed}-\text{Probablity of outcome in unexposed}\) | -1 to 1 | Probability matrix |
2. Constructing Natural History Transition Probability Matrix
Our first objective is to create the transition probability matrix for the natural history model. We will create this matrix through the following steps:
Define the transition rate matrix. For this step we will insert all the rate parameters, and any necessary adjustments to rates (e.g., hazard rates for certain transitions).
“Embed” the transition rate matrix into the transition probability matrix using matrix exponentiation. For this step we can simply insert the rate matrix into the online conversion tool we have created for this exercise.
Throughout, we will color-code various parameters in the model using the following PostIt colors:
| Probability |
| Rate adjusted for timestep |
| Hazard Ratio |
| Relative Risk |
| Odds Ratio |
| Constructed from other cells |
What does “Rate adjusted for timestep mean?” Suppose the literature based rate is 0.03 over 5 years, but our model uses a 1-year cycle (timestep). We can convert this rate to a one year rate by dividing by 5 (i.e., 0.006 = 0.03 / 5)
What does “Constructed from other cells mean?” Each row of the transition probability matrix should sum to one, since we need to make sure that everyone in our modeled cohort ends up somewhere! Therefore, the diagonal elements of the transition probability matrix are simply one minus the sum of the other cells in the same row.
Similarly, in a rate matrix the rows must sum to zero. So the diagonal cell is the negative sum of all the other row values.
| Probability |
| Rate adjusted for timestep |
| Hazard Ratio |
| Relative Risk |
| Odds Ratio |
| Constructed from other cells |
2.1 Use the flipboards/whiteboard and post-it notes to construct a natural history rate matrix.
2.2 Convert the rate matrix to a transition probability matrix
For this task we will use the web-based tool that was developed for this exercise. This tool allows you to fill in the raates in the rate matrix, and it will automatically calculate the transition probability matrix for you.
2.3 Use Amua to Create a Markov Model with the Calculated Transition Probabilities
3. Adding Additional Strategies
We will next evaluate structure transition matrices for four distinct strategies:
1. Natural History Model - Represents the current standard of care with no intervention
- The transition probability matrix for this strategy was already defined above.
2. Prevention Strategy
- Aimed at reducing the risk of developing progressive disease
- Relative risk of developing progressive disease (
RR_AP): 0.75
3. Treatment Strategy
Focused on reducing mortality once progressive disease develops
Odds ratio of death from progressive disease (
OR_PDd): 0.80Baseline annual probability of death in underlying clinical trial (
p0_OR_Pdd): 0.03
4. Cure Strategy
- Novel approach that can potentially reverse disease progression
- 10-year disease remission rate (
r_PA_Cure): 0.50
This strategy introduces a new transition (P A) not present in the natural history model!
3.1 Please Construct a New Transition Probability Matrix for Each Strategy
| Parameter | Description | Value |
|---|---|---|
r_AP |
10-year progressive disease incidence rate | 0.40 |
r_Db |
Background mortality rate | 0.006 |
HR_PDd |
Hazard rate of death from progressive disease relative to background mortality | 3.0 |
RR_AP |
Relative risk of developing progressive disease (Strategy A) | 0.75 |
OR_PDd |
Odds-ratio of death from progressive disease (Strategy B) | 0.80 |
p0_OR_PDd |
Baseline probability of death in underlying clinical trial (Strategy B) | 0.03 |
r_PA_trtC |
10-year disease remission rate (Strategy C) | 0.50 |
You can convert an odds ratio to a relative risk (i.e., ratio of probabilities) if we know the baseline (unexposed) probability of the outcome, \(p_0\). \(RR = \frac{\text{Probability of outcome in exposed}}{\text{Probablity of outcome in unexposed}} = \frac{p_1}{p_0} = \frac{OR}{(1-p_0+(p_0 \times OR))}\)
4.0 Run the Full Model In Amua
Please set up the full model with all strategies in Amua and run it for \(t=100\) cycles for a population cohort of 100,000 with the following primary outcomes:
- Total life expectancy
- QALYs (use a utility weight of 1.0 for asymptomatic disease and 0.92 for progressive disease)
- Total expected disease-related deaths.