
Primary Results: Progressive Disease
| Strategy | ICER |
|---|---|
| Status Quo | - |
| Treatment | 49,513 |
| Prevention | 139,630 |
Treatment is cost-effective at WTP=$50,000/QALY—but barely.
How sensitive is this result to the input parameter values used?
| Strategy | ICER |
|---|---|
| Status Quo | - |
| Treatment | 49,513 |
| Prevention | 139,630 |
Treatment is cost-effective at WTP=$50,000/QALY—but barely.
How sensitive is this result to the input parameter values used?
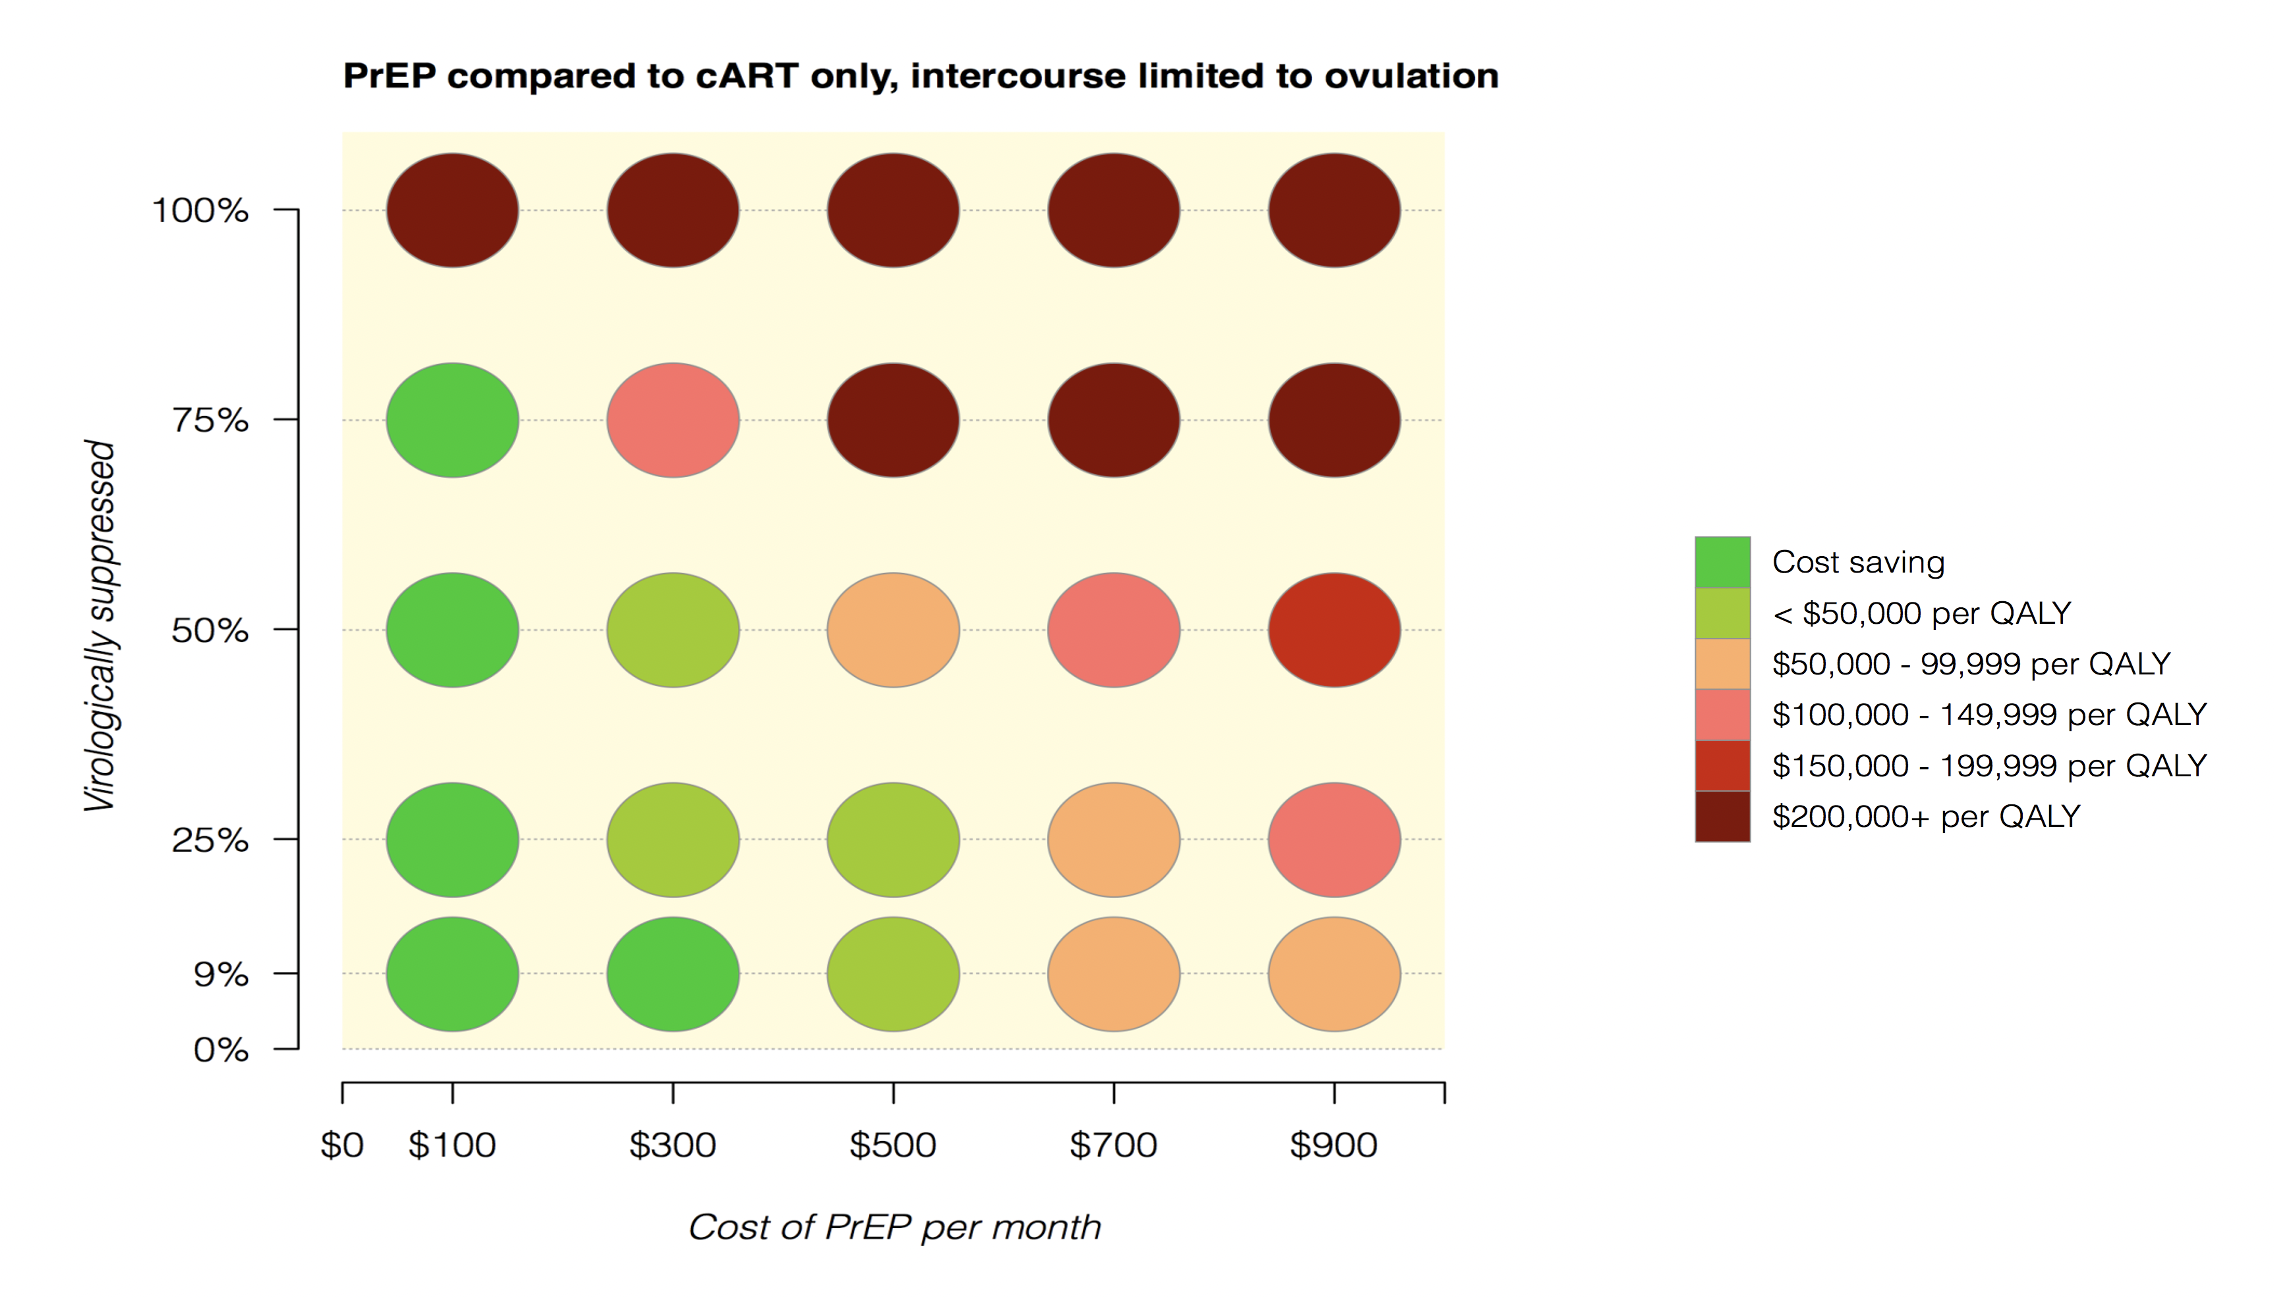
Markov model examining strategies for HIV prevention among serodiscordant couples seeking conception (woman does not have HIV and male has HIV)
We know that if the male partner is consistently on medication for HIV (i.e., resulting in virologic suppression), then the risk of transmission is small regardless of the woman taking PrEP (pre-exposure prophylaxis)
And we also know that PrEP has traditionally been really costly
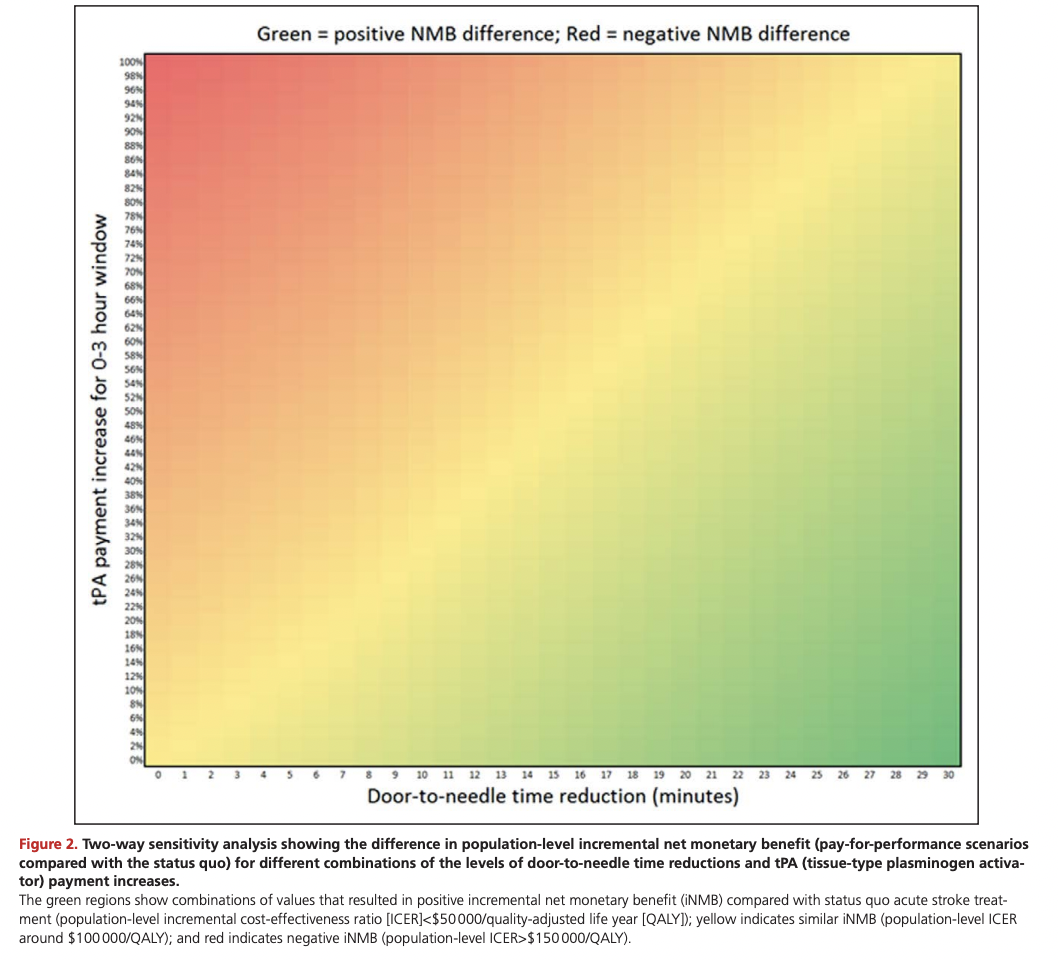
Under pay for performance policies in the US, physicians or hospitals are paid more for meeting evidence-based quality targets
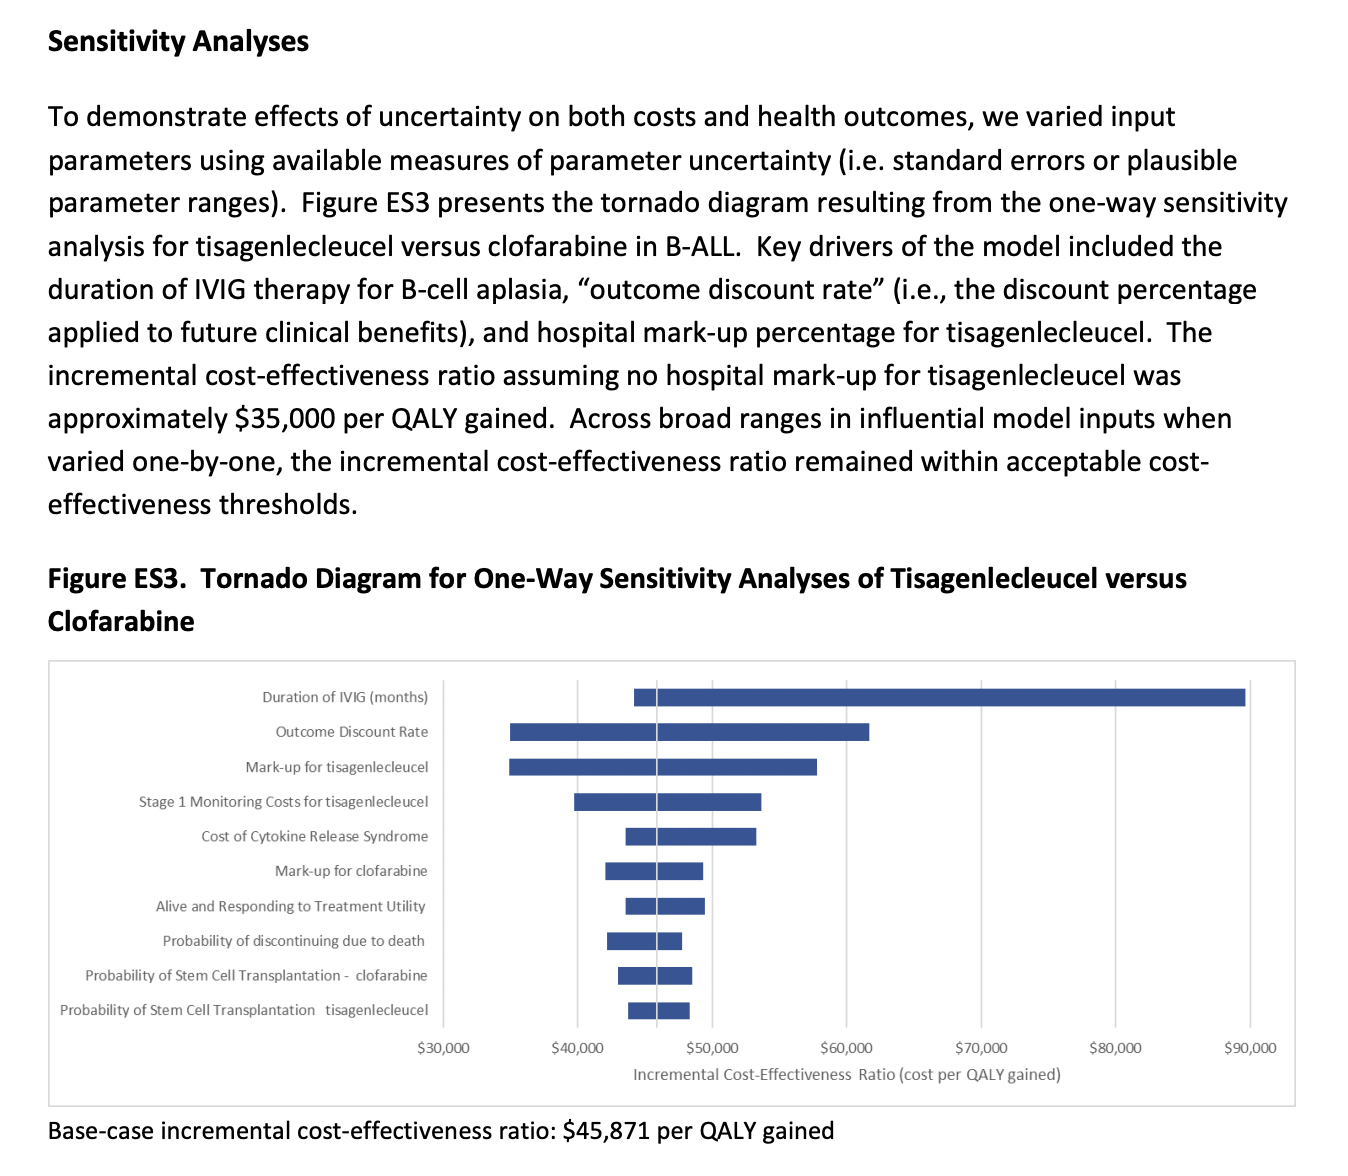
Study objective: Illustrate how pay-for-performance incentives can be quantitatively bounded using cost-effectiveness modeling, through the application of reimbursement to hospitals for faster time-to-tPA for acute ischemic stroke
When administered quickly after stroke onset (within three hours, as approved by the FDA), tPA helps to restore blood flow to brain regions affected by a stroke, thereby limiting the risk of damage and functional impairment
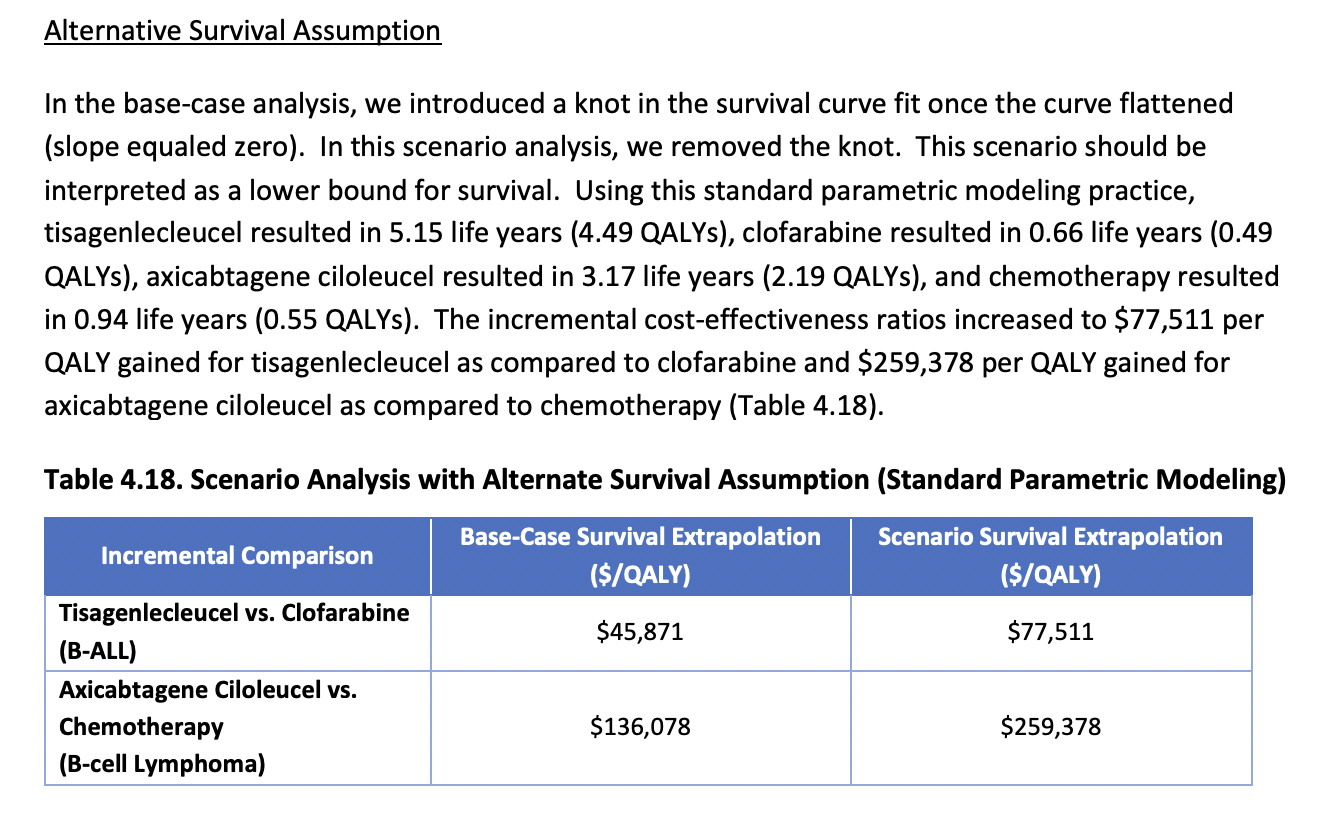
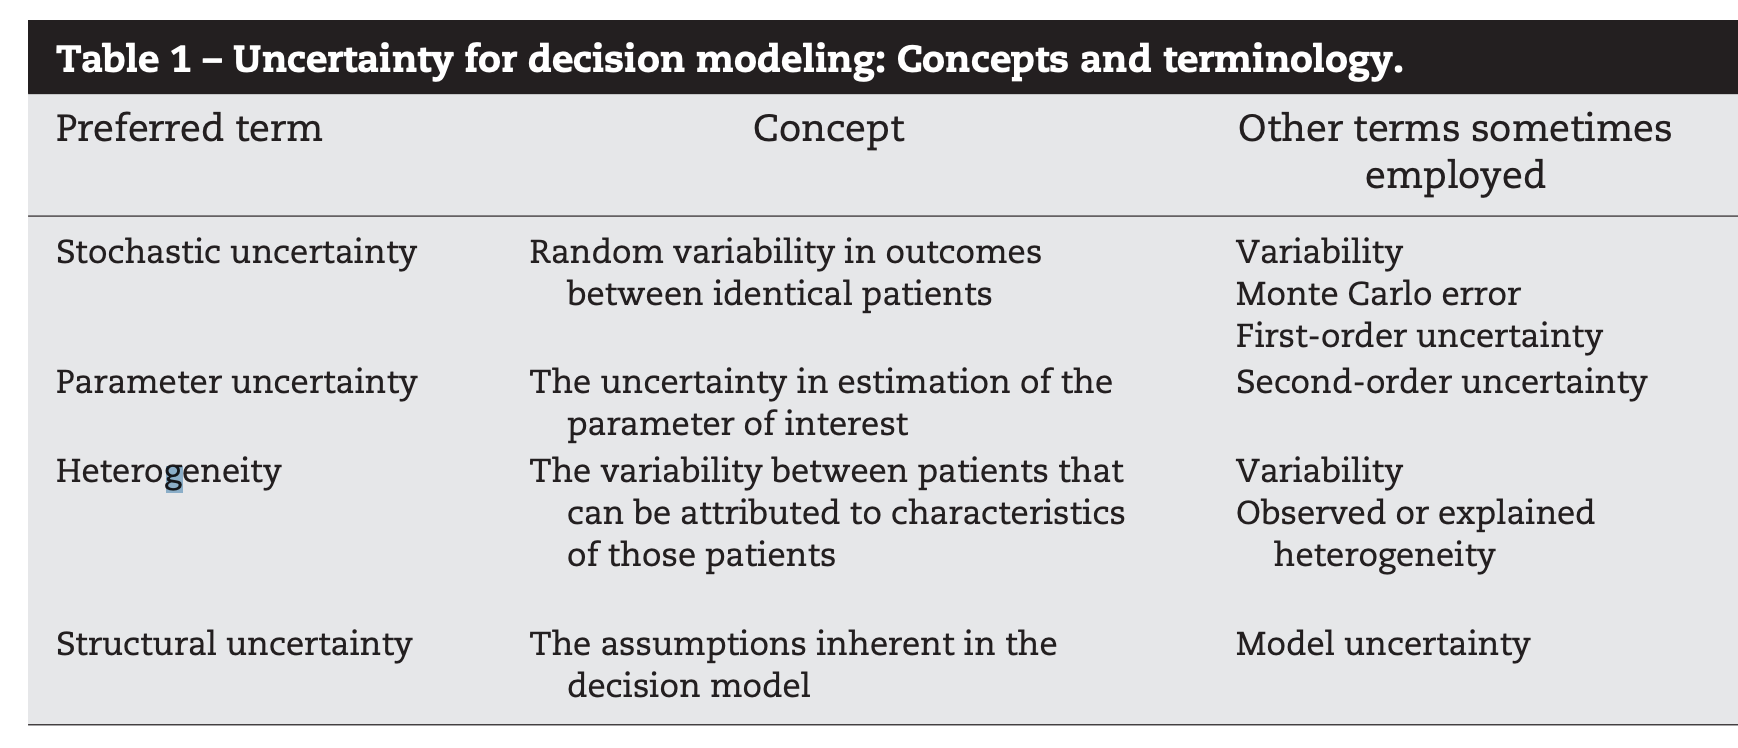
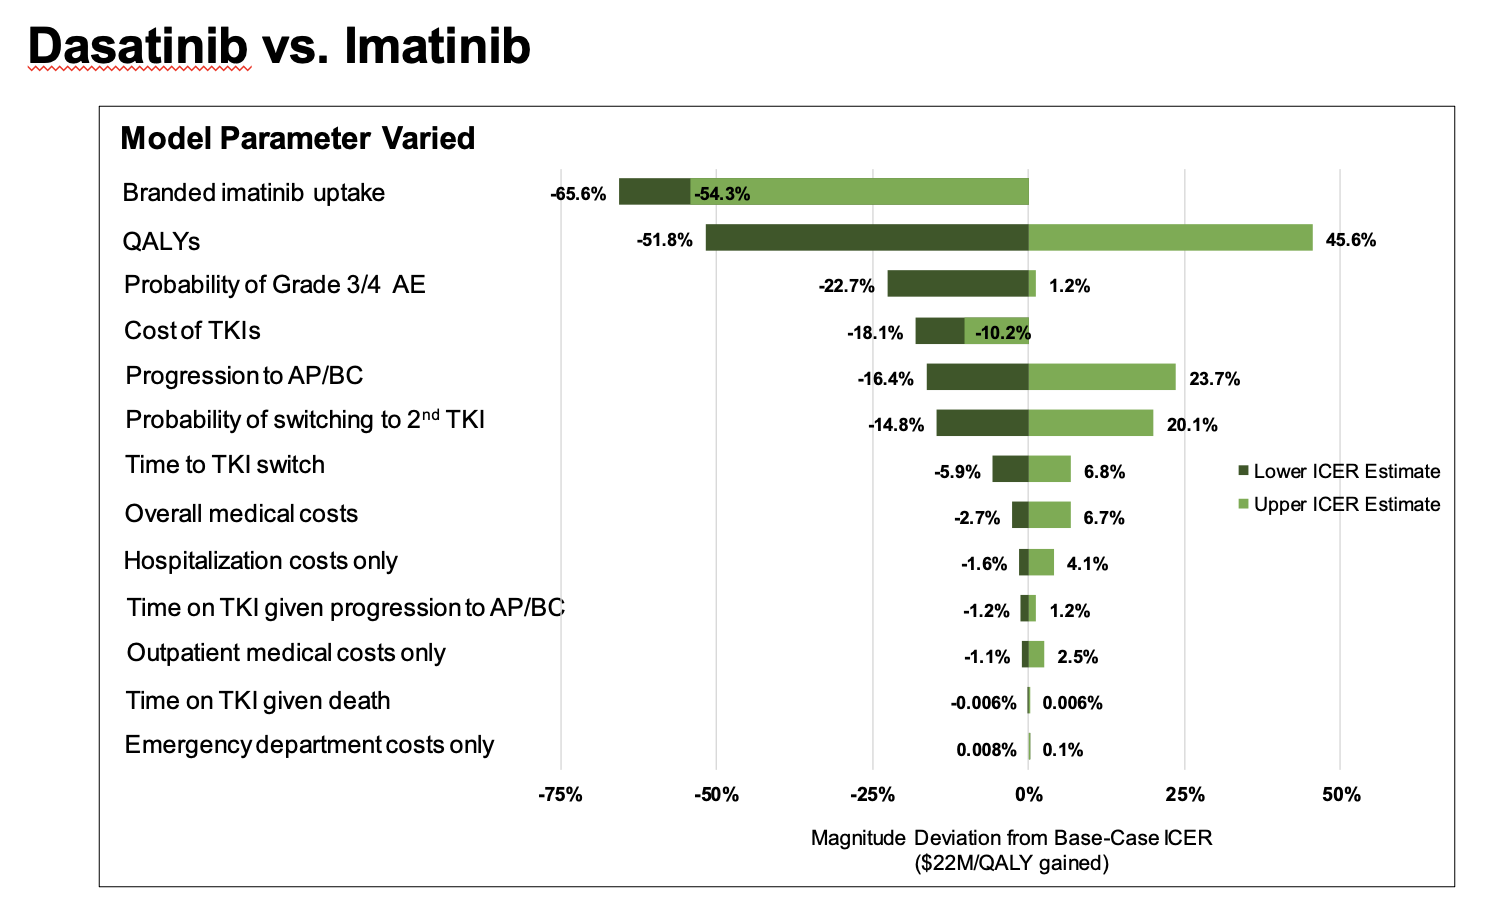
Focuses more on model assumptions rather than parameter uncertainty
Could include separate analysis on:
Subgroups/sub-populations, including different age cohorts & risk levels
Different perspectives (societal; modified societal; etc)
> Hypothetical scenarios (“optimistic” and “conservative” scenarios; for > example, if we have little evidence of long-term survival associated > with medication X, we might have an optimistic versus conservative > scenario)
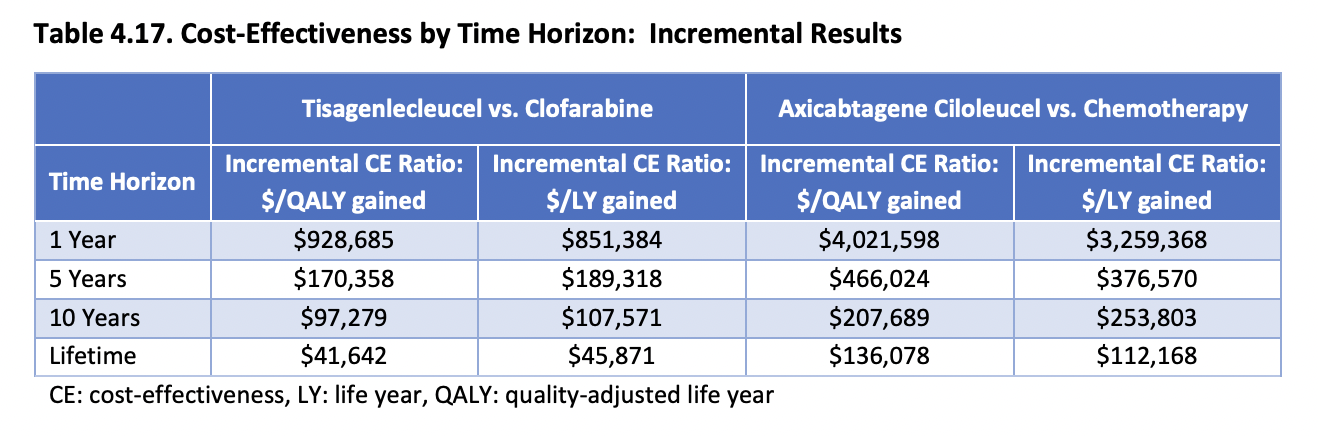
Time horizons
Roles of PSA’s in decision science
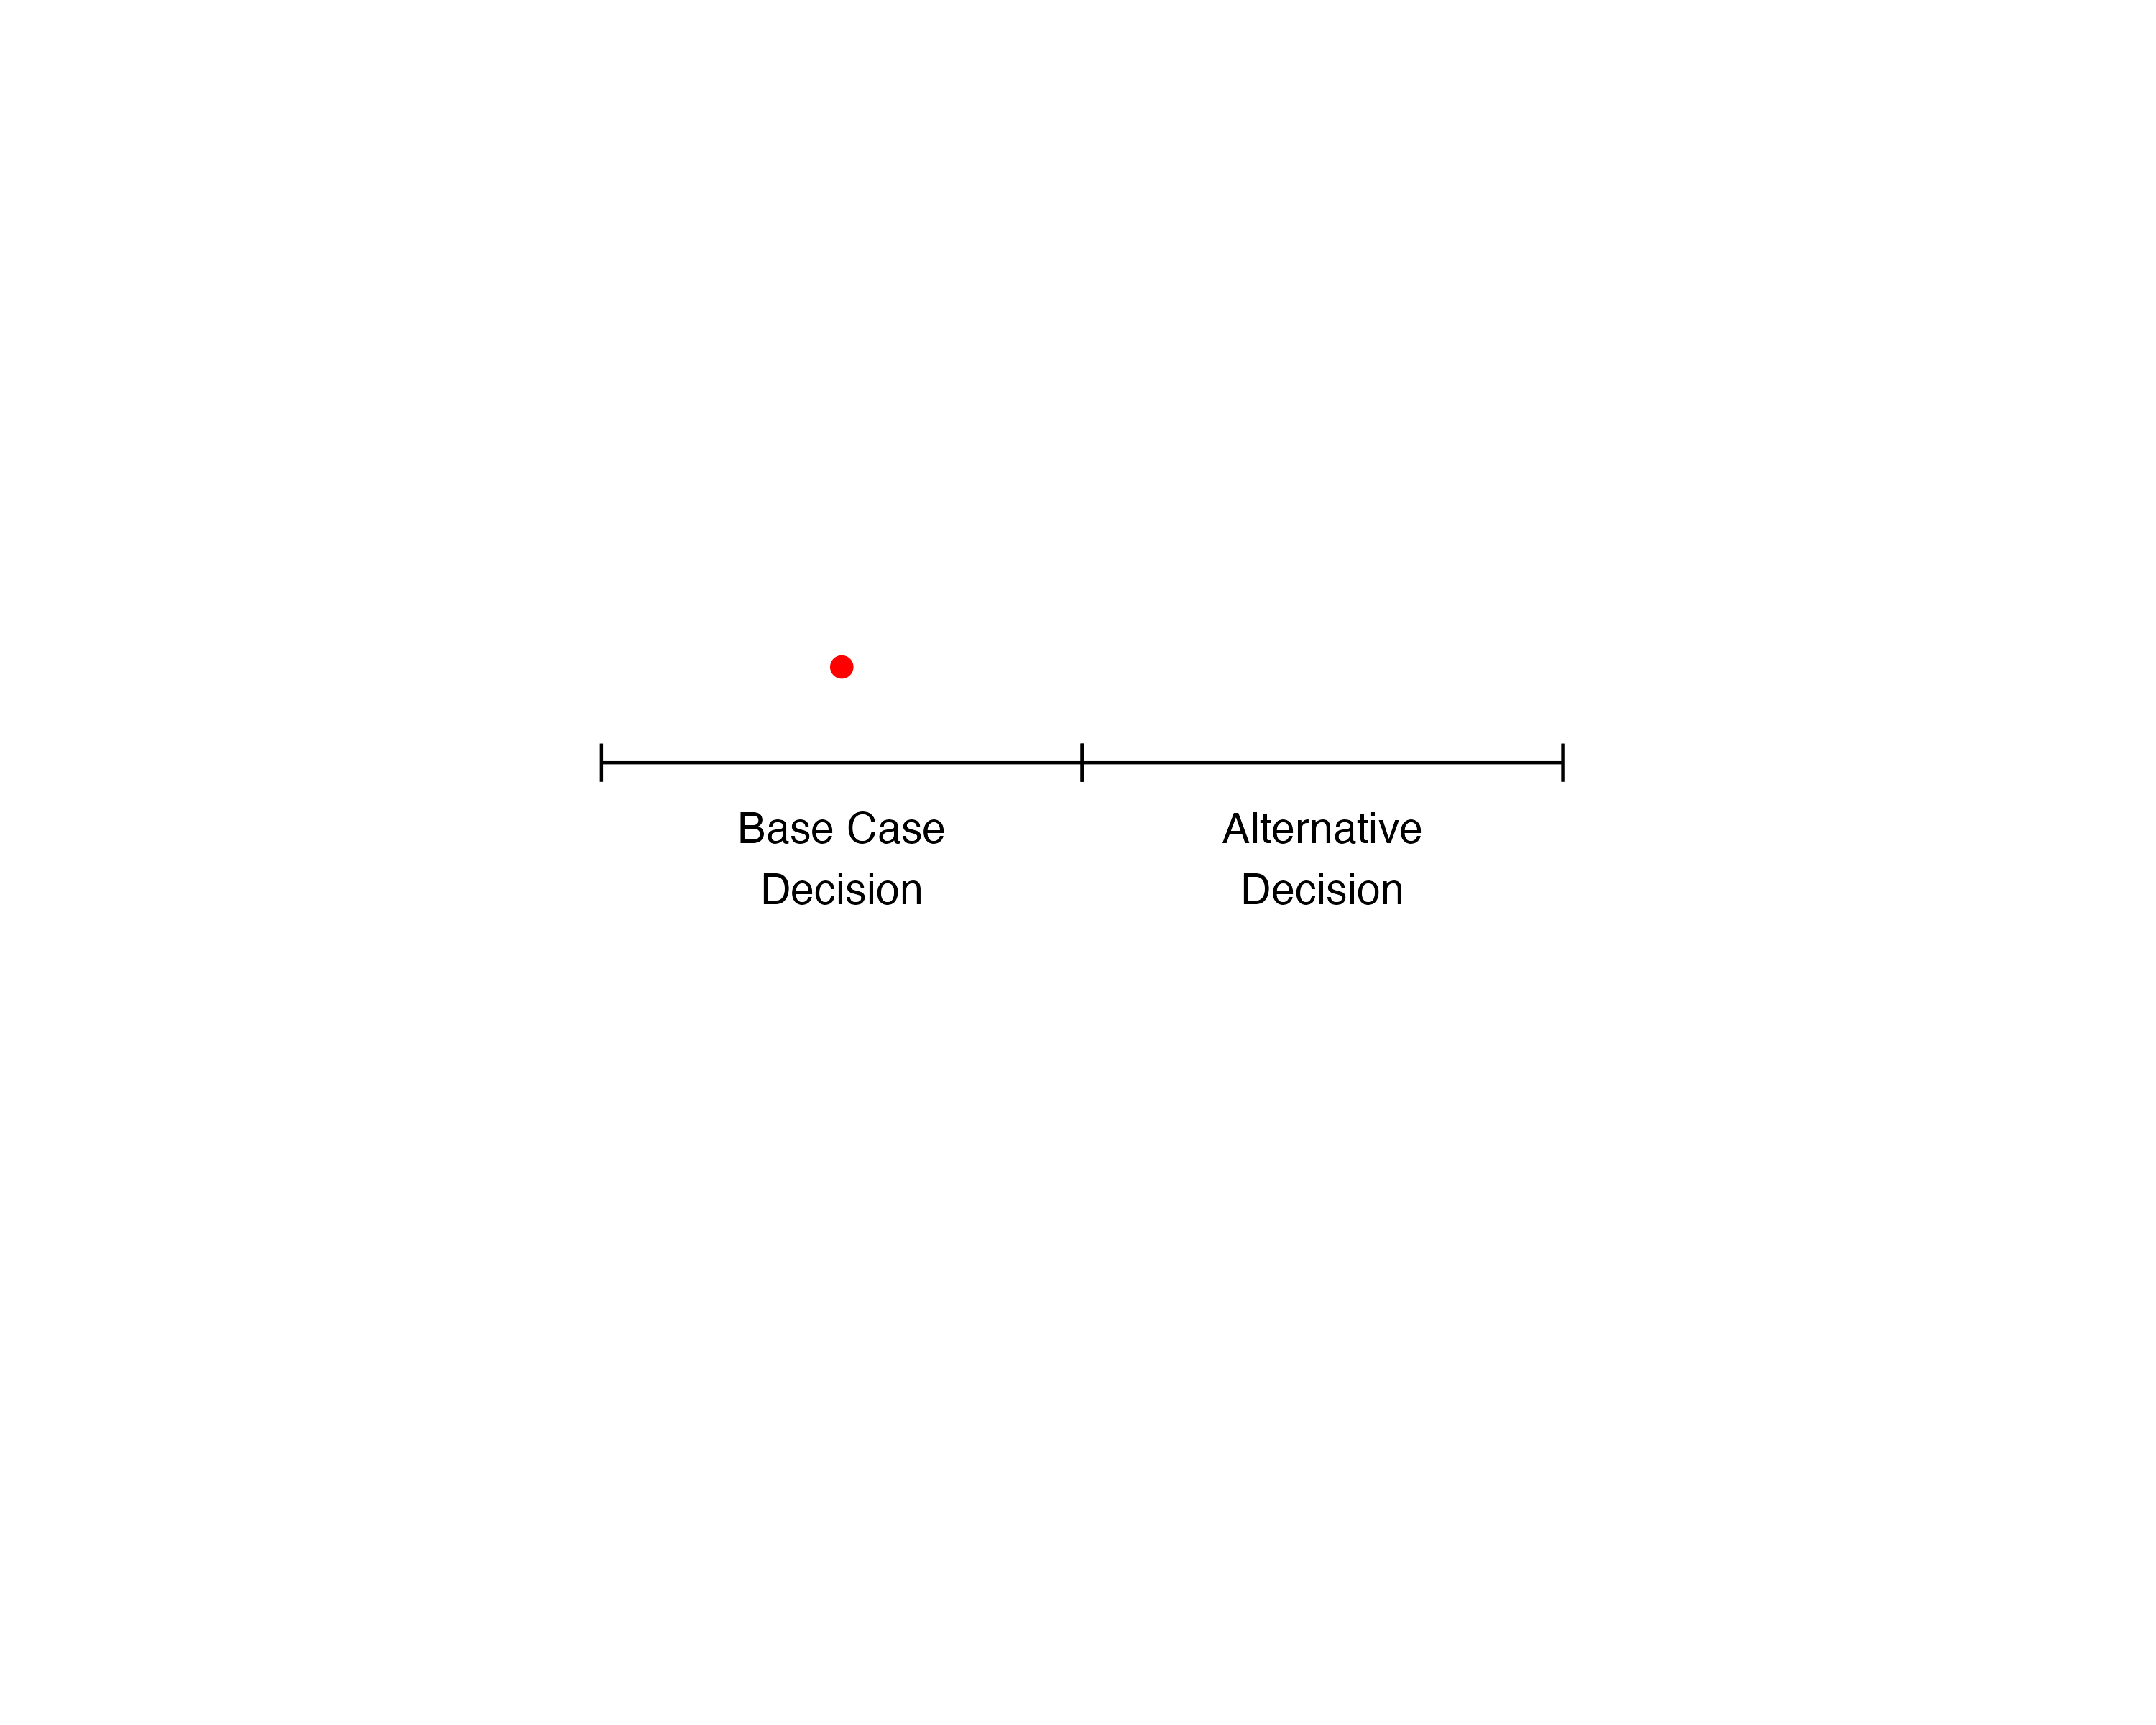
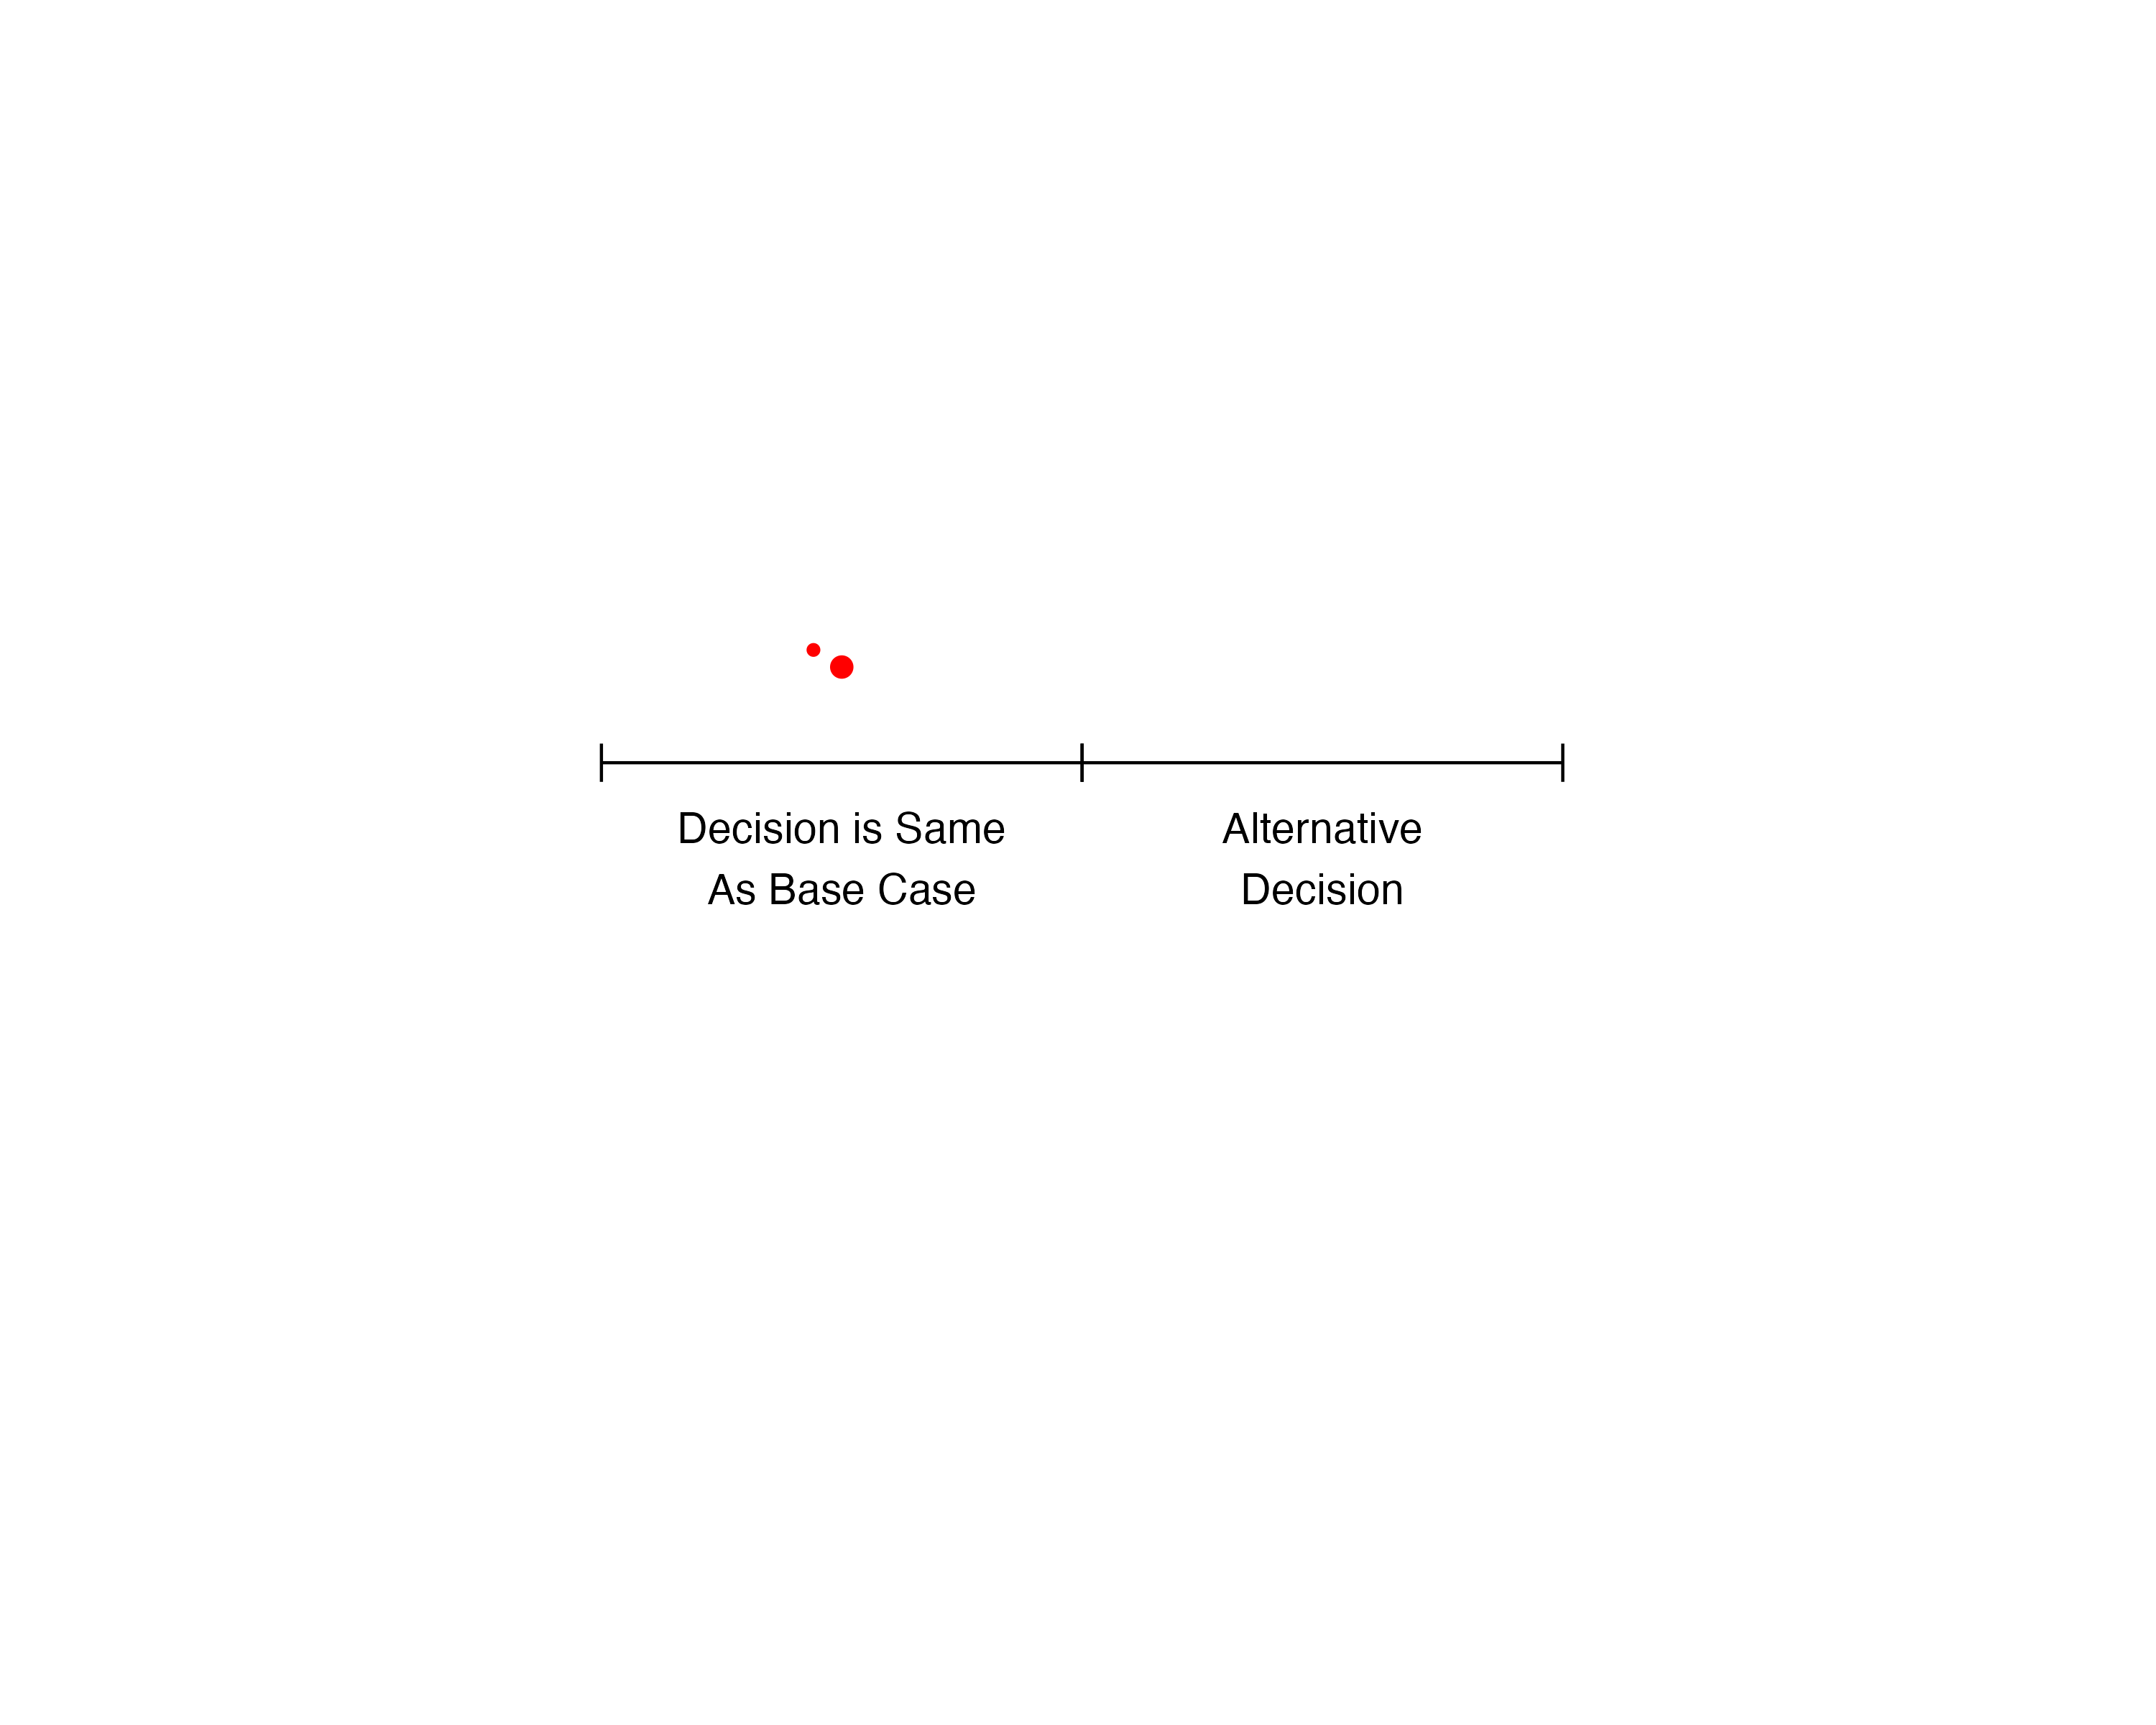
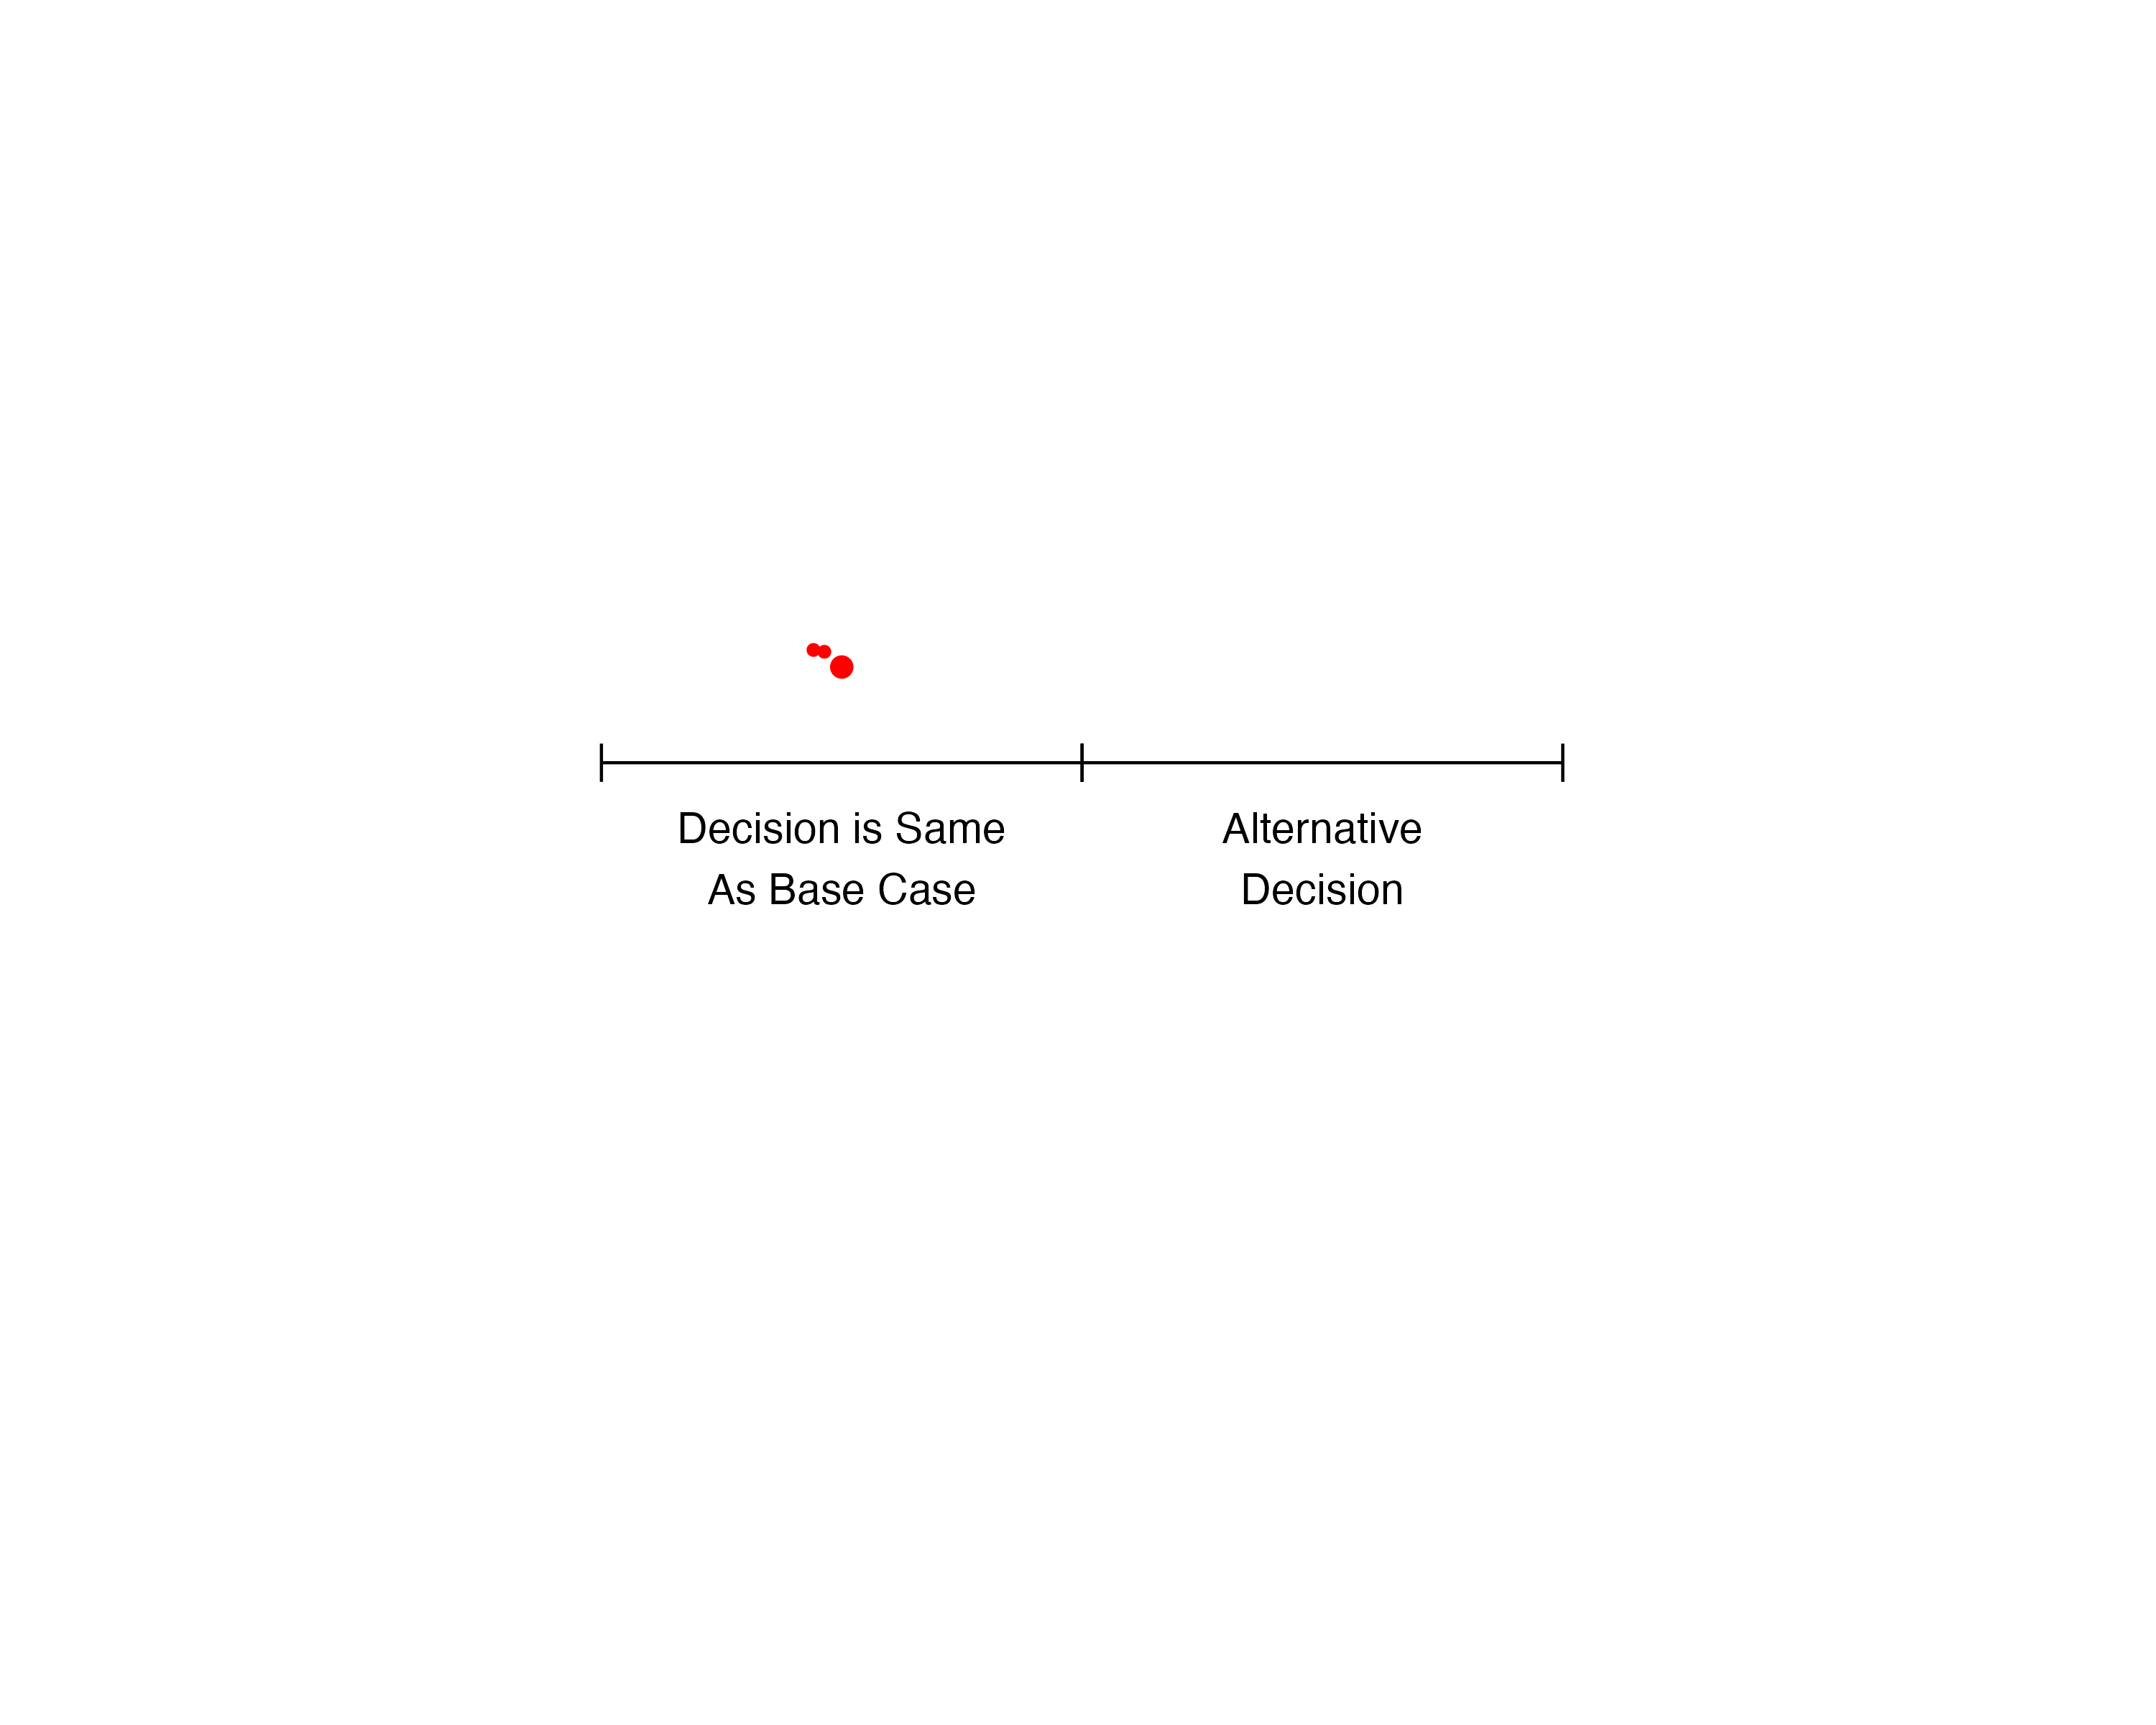
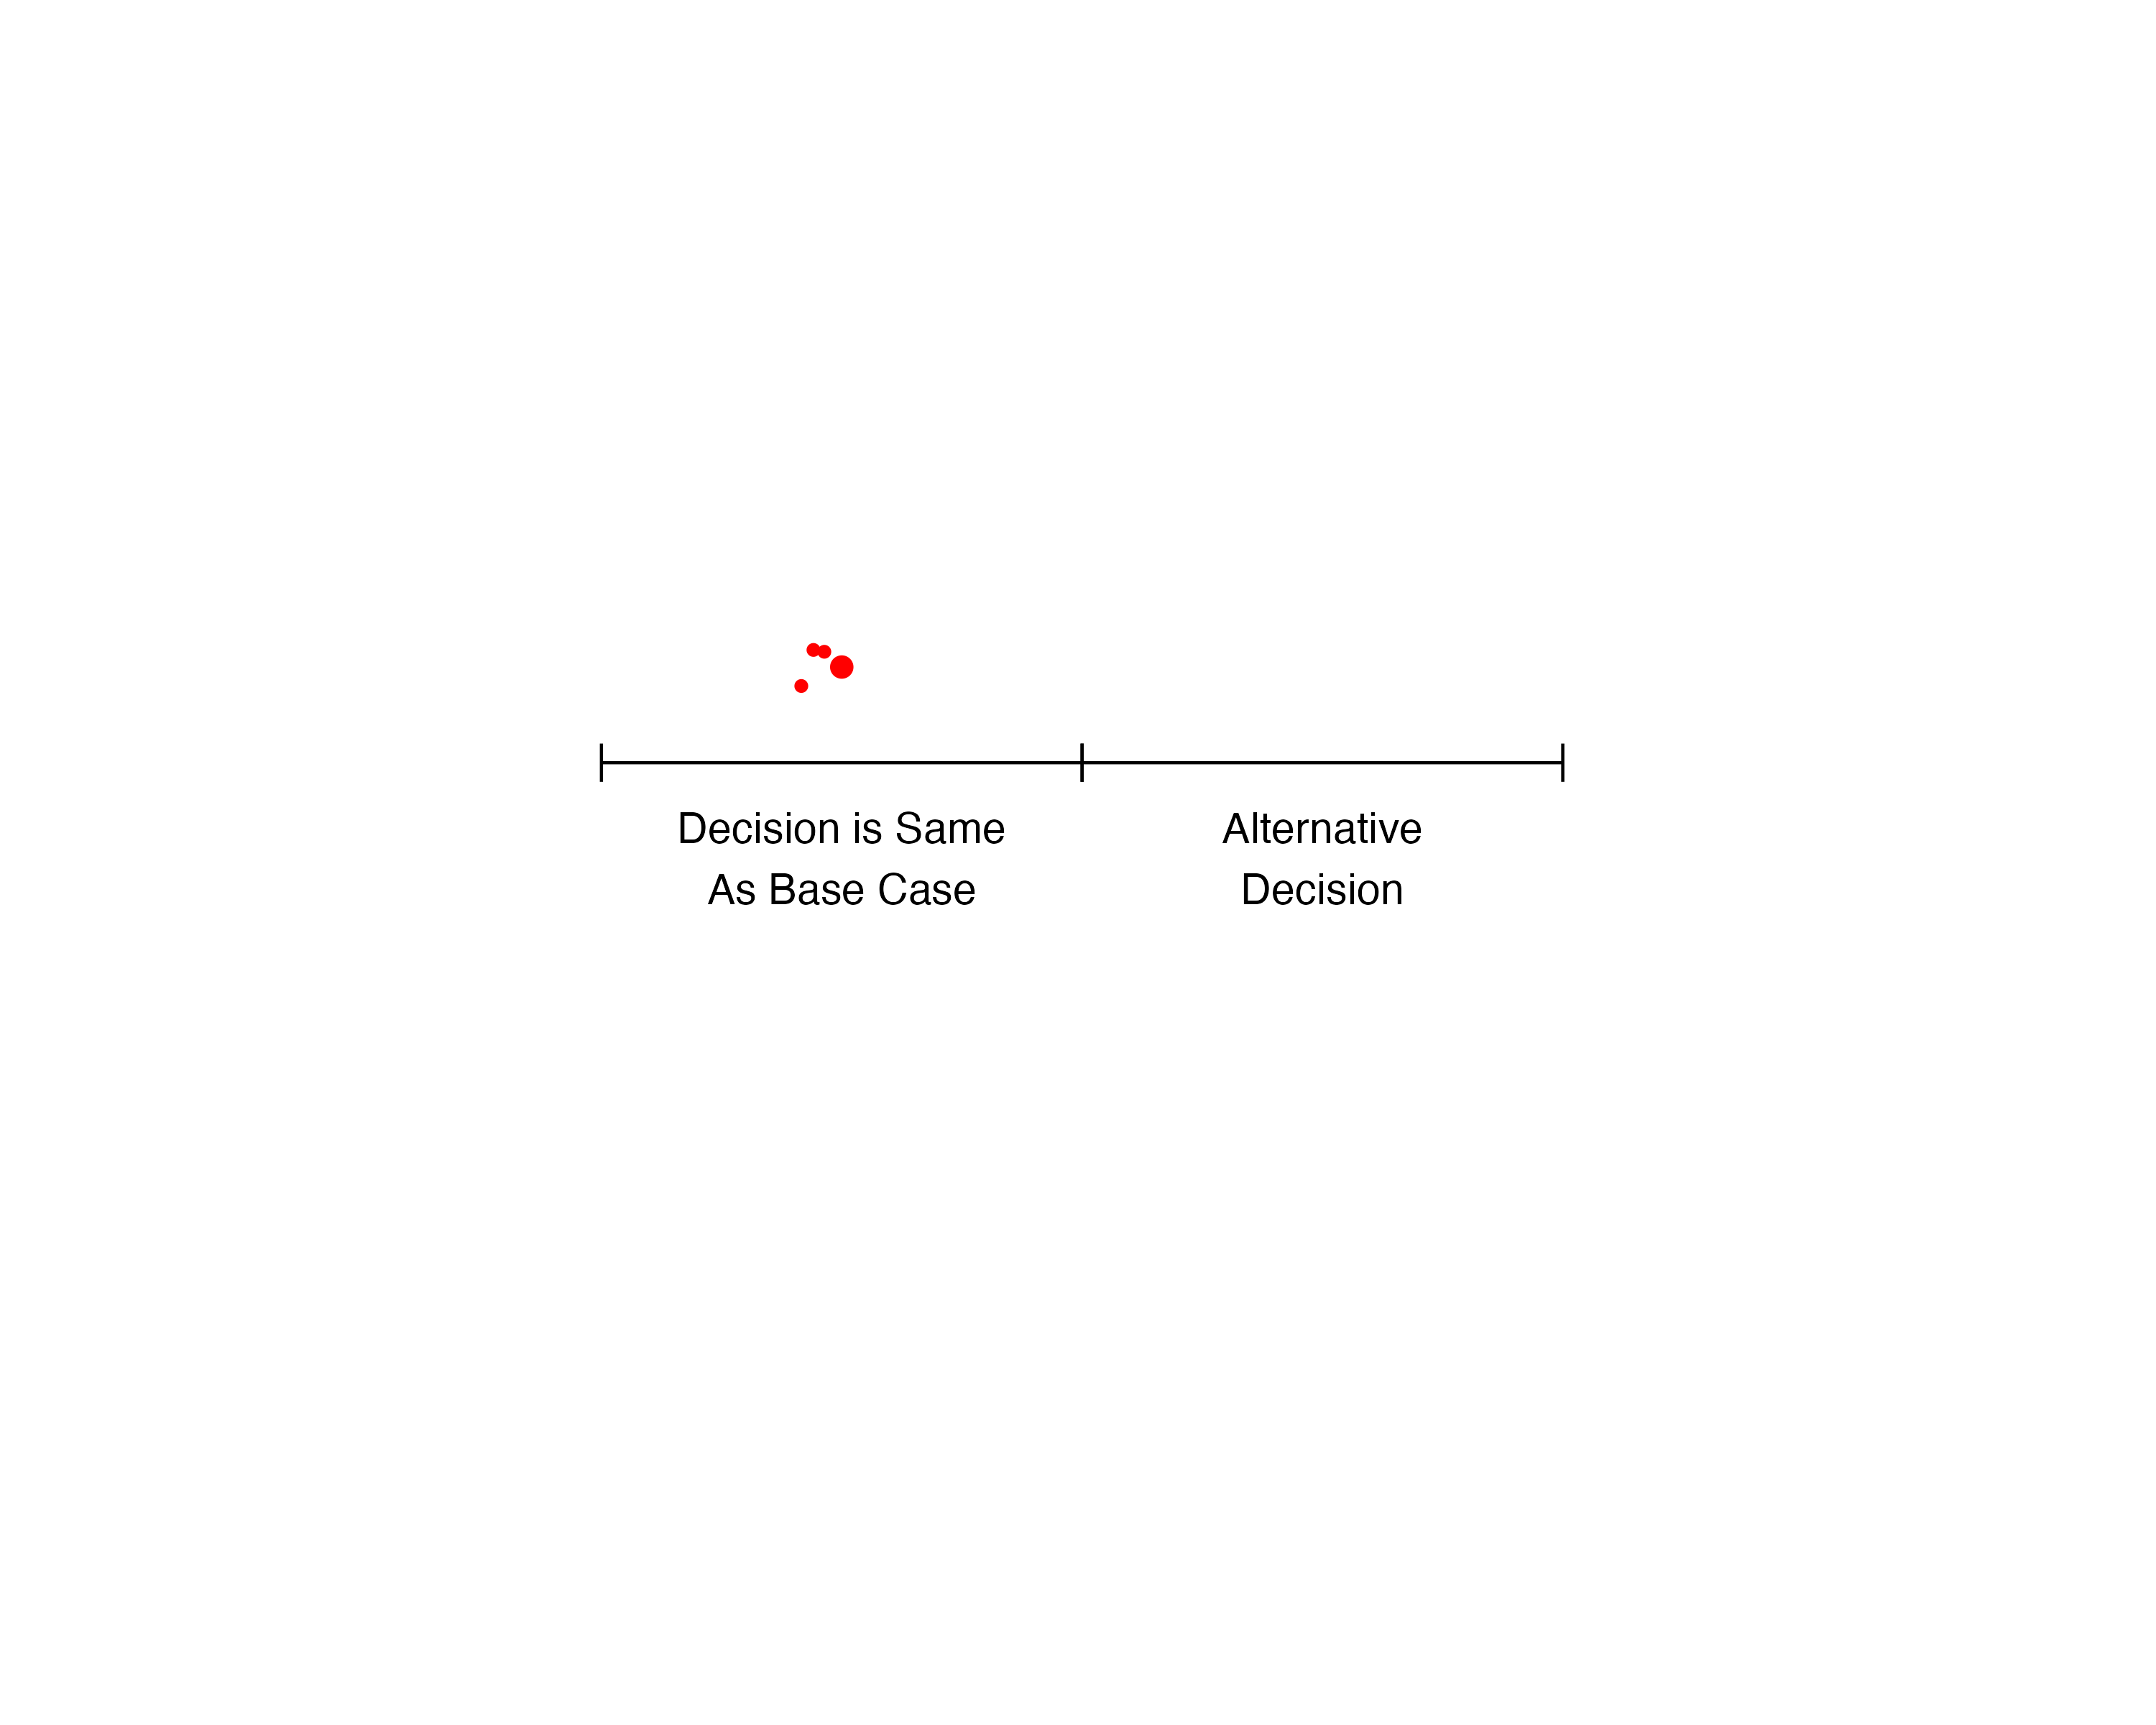
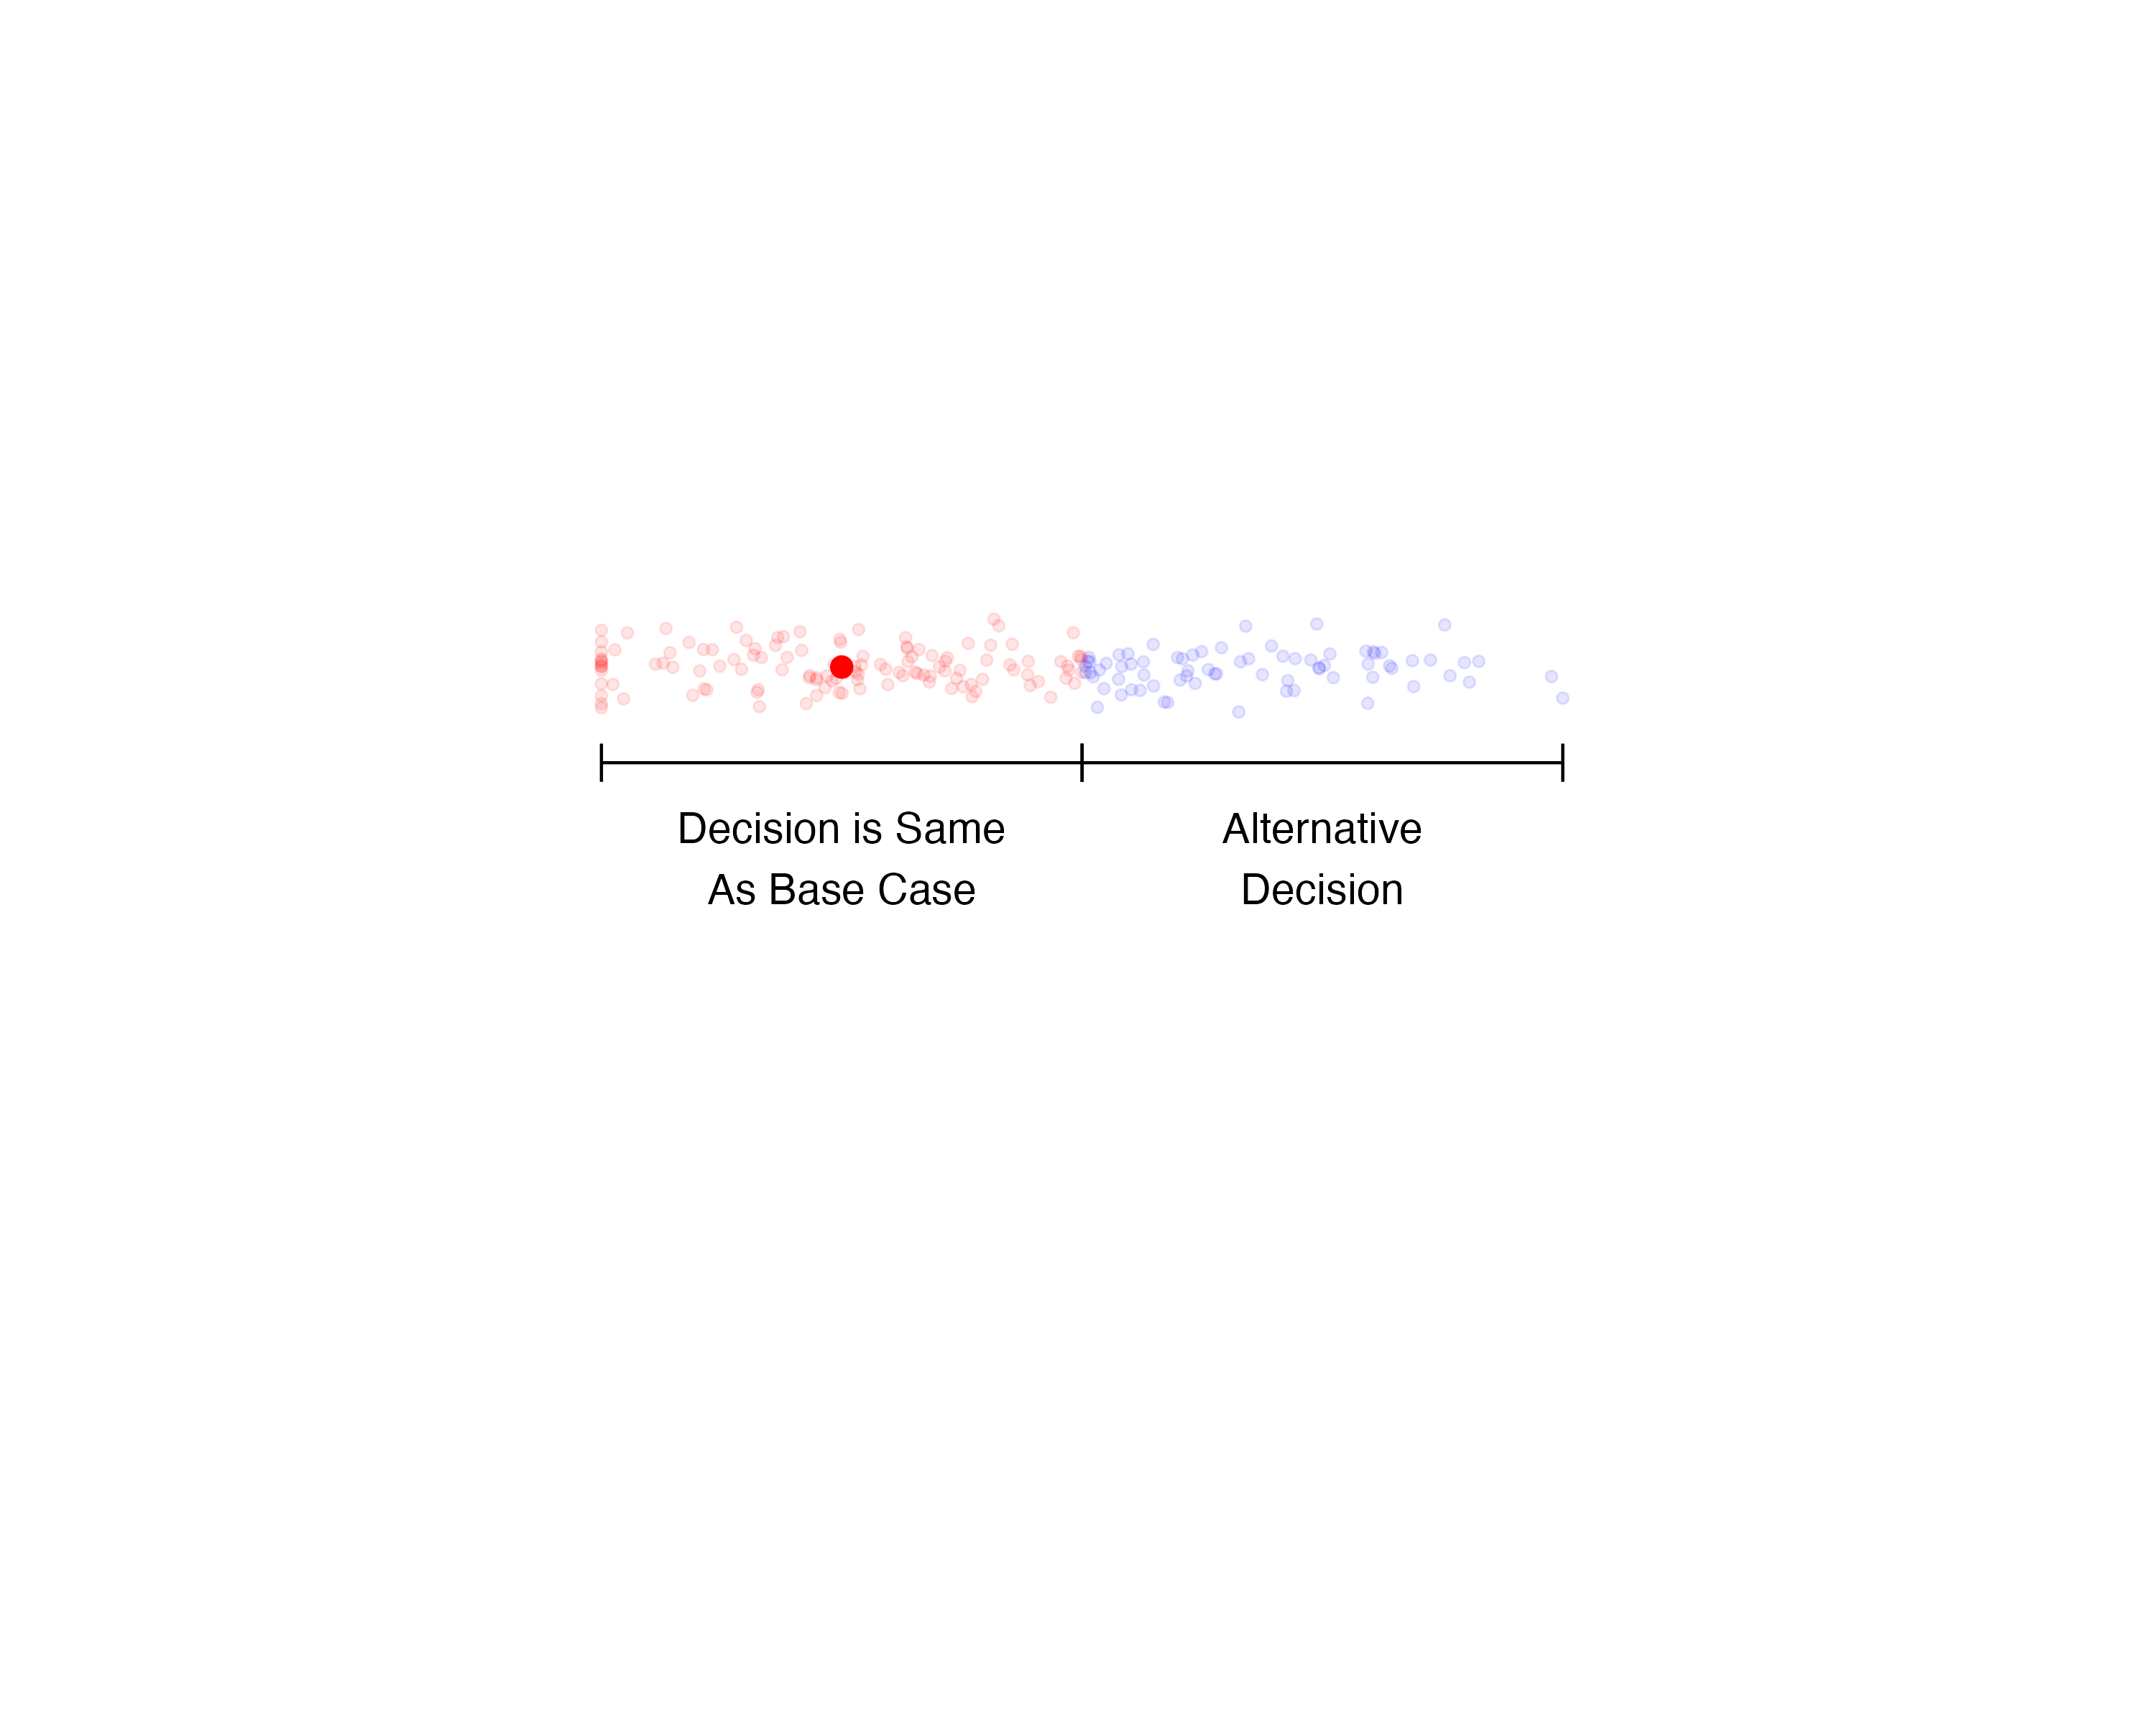
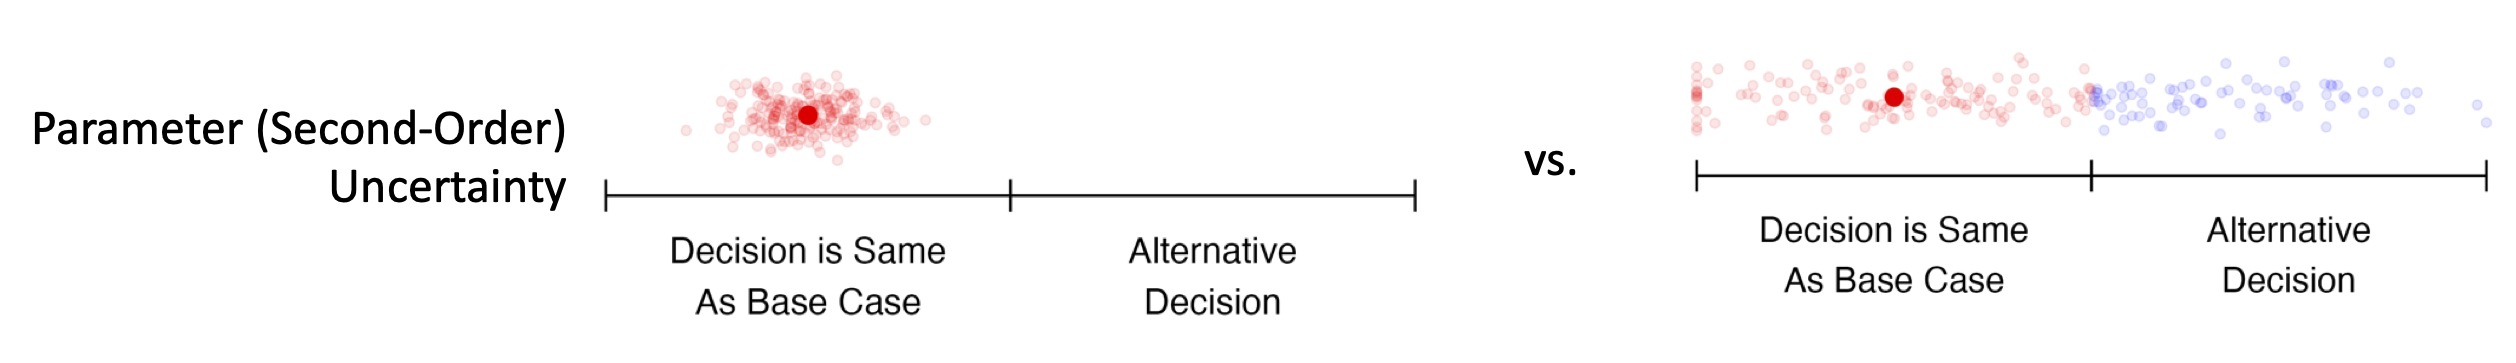
In this example, model outputs are sensitive to uncertainty, but decisions are not.
In this example, model outputs are sensitive to uncertainty, but decisions are not.

Both model outputs and decisions are sensitive to uncertainty.
Both model outputs and decisions are sensitive to uncertainty.
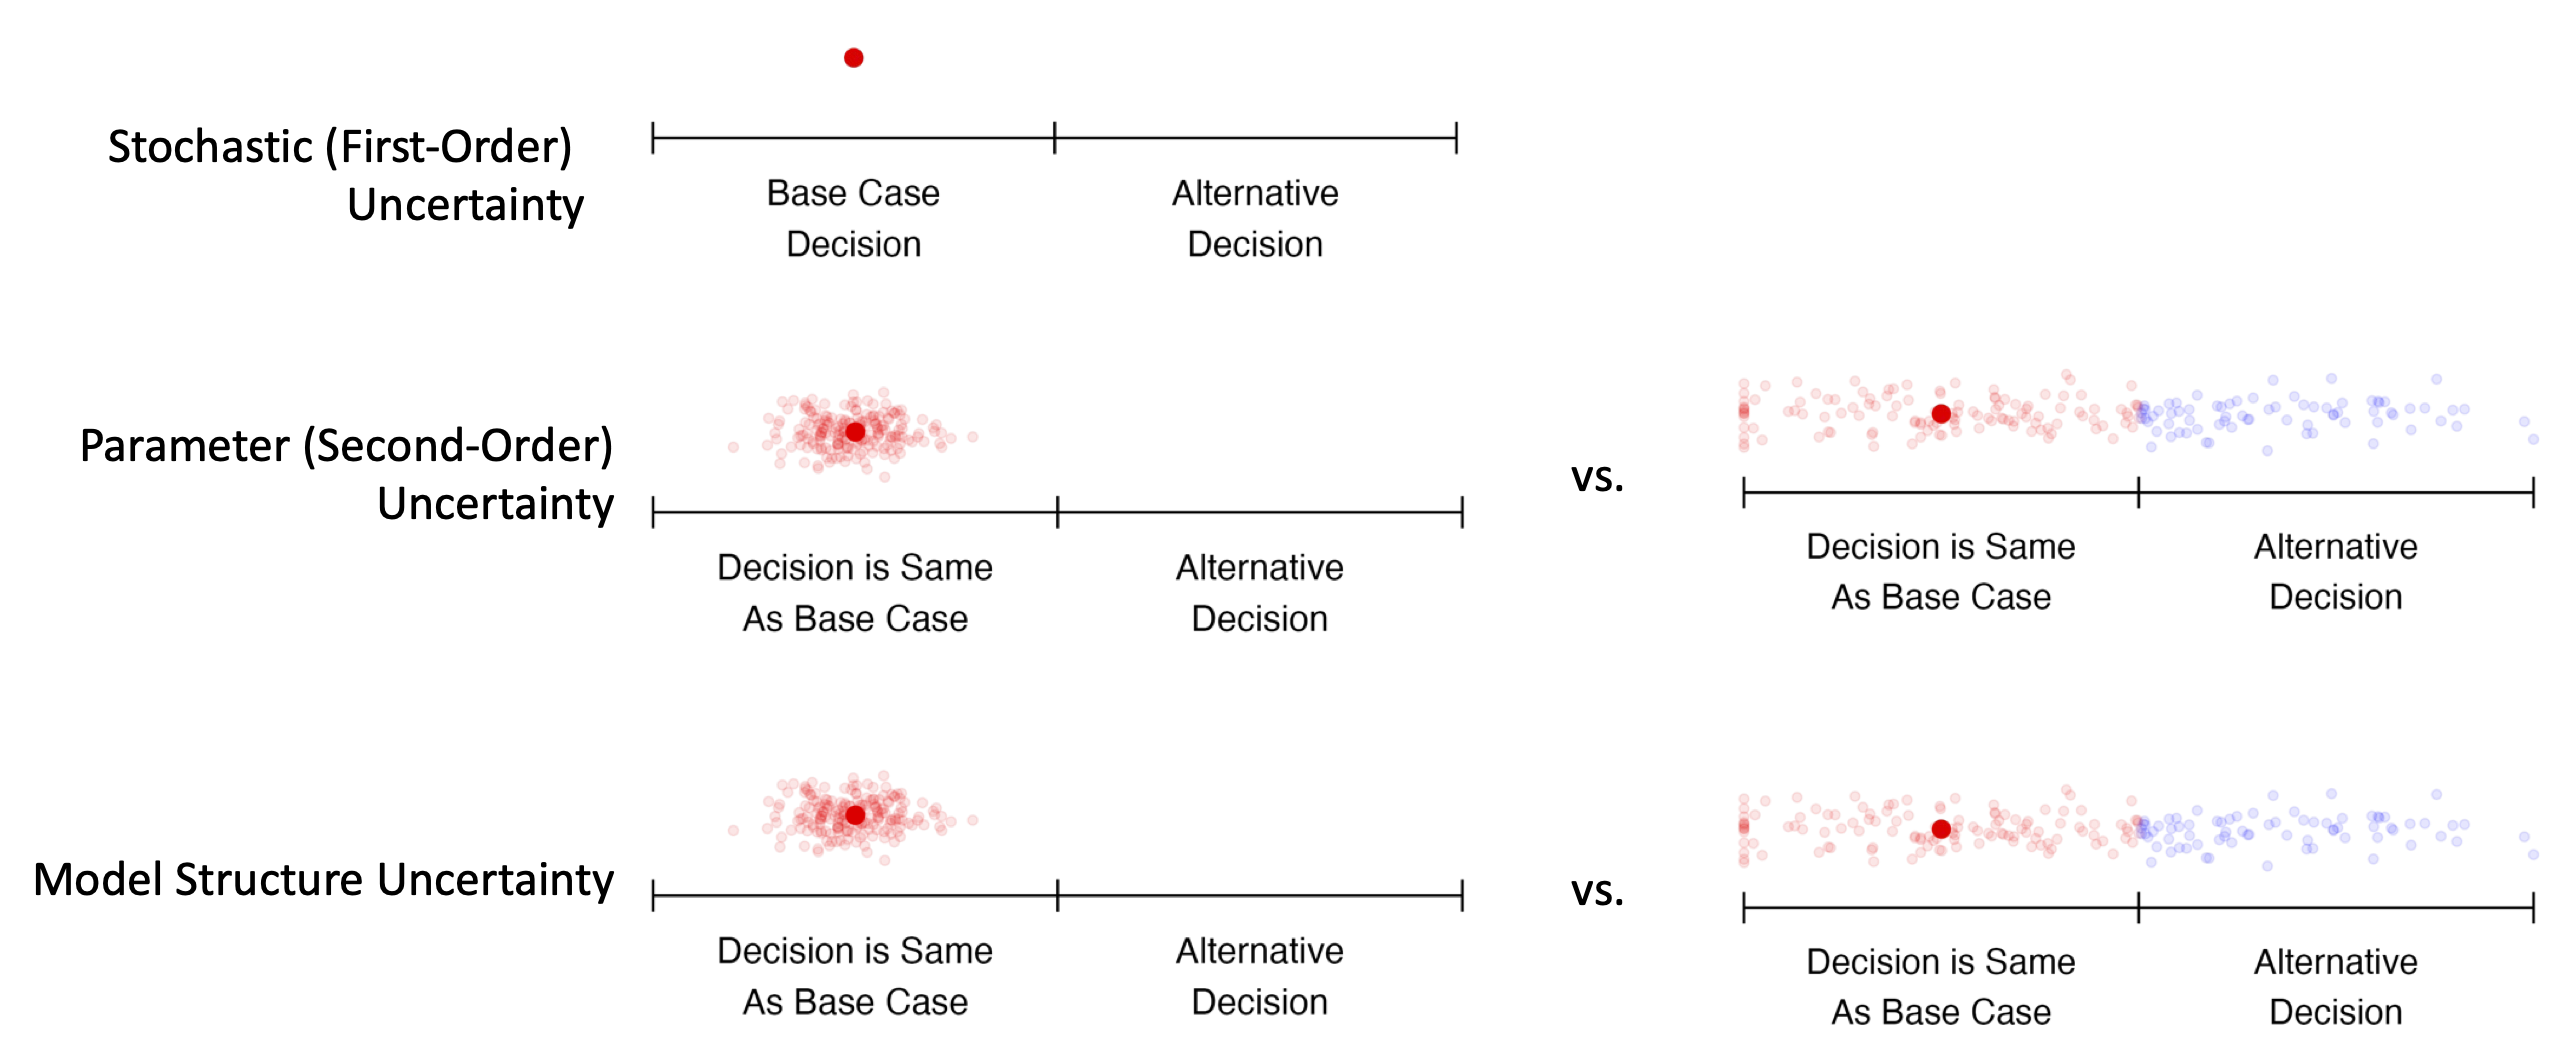
Note that this picture represents common scenarios; uncertainty may be greater or lesser in any particular modeling context.
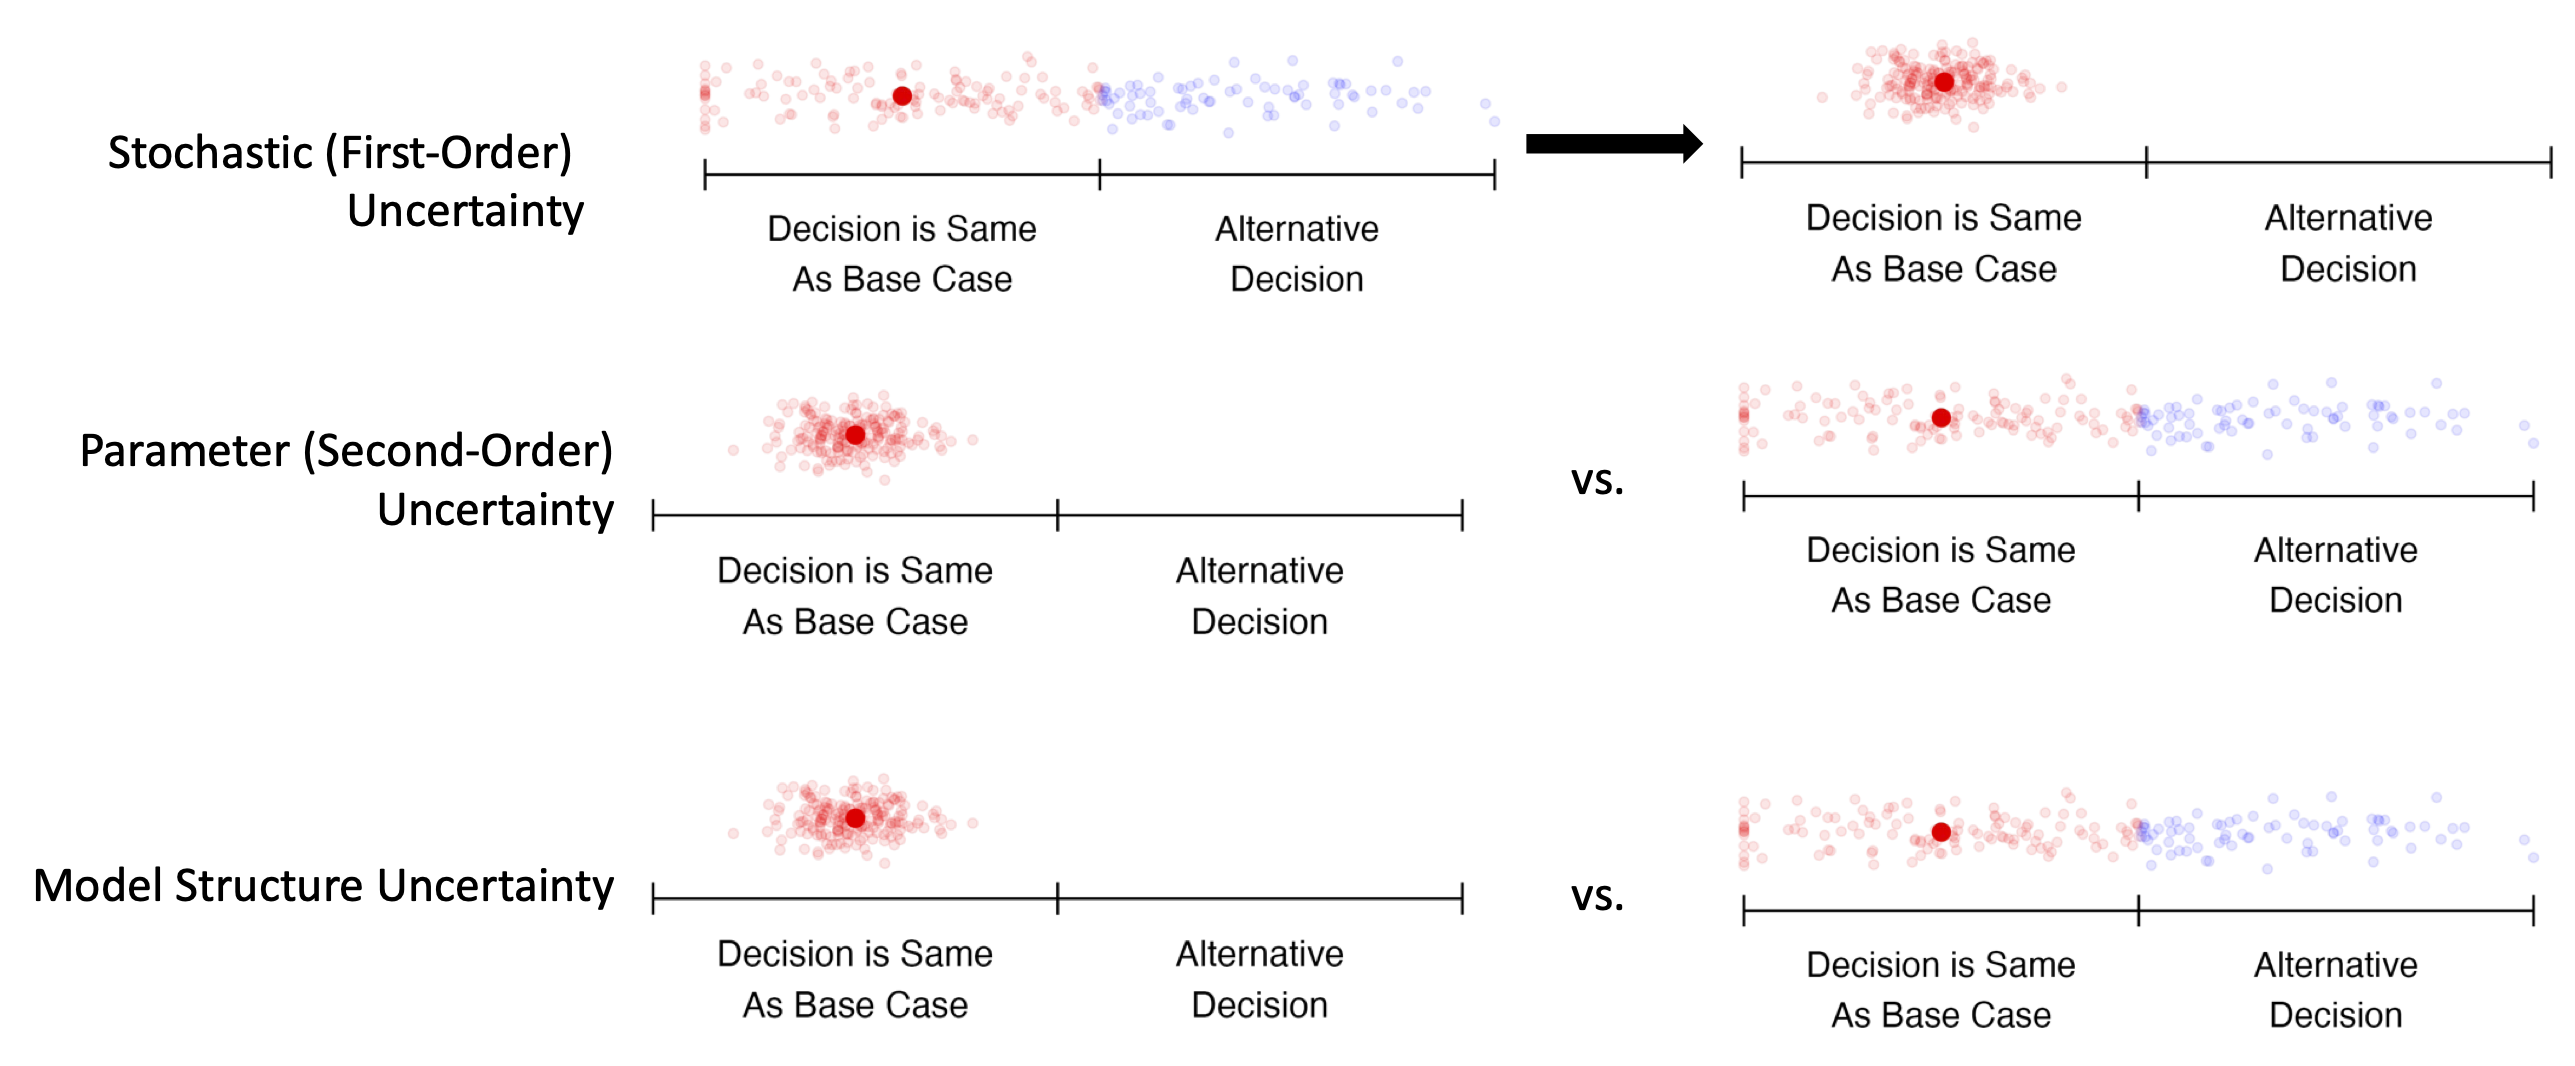
Note that this picture represents common scenarios; uncertainty may be greater or lesser in any particular modeling context. DES = discrete event simulation
| Parameter Type | Distribution |
|---|---|
| Probability | beta |
| Rate | gamma |
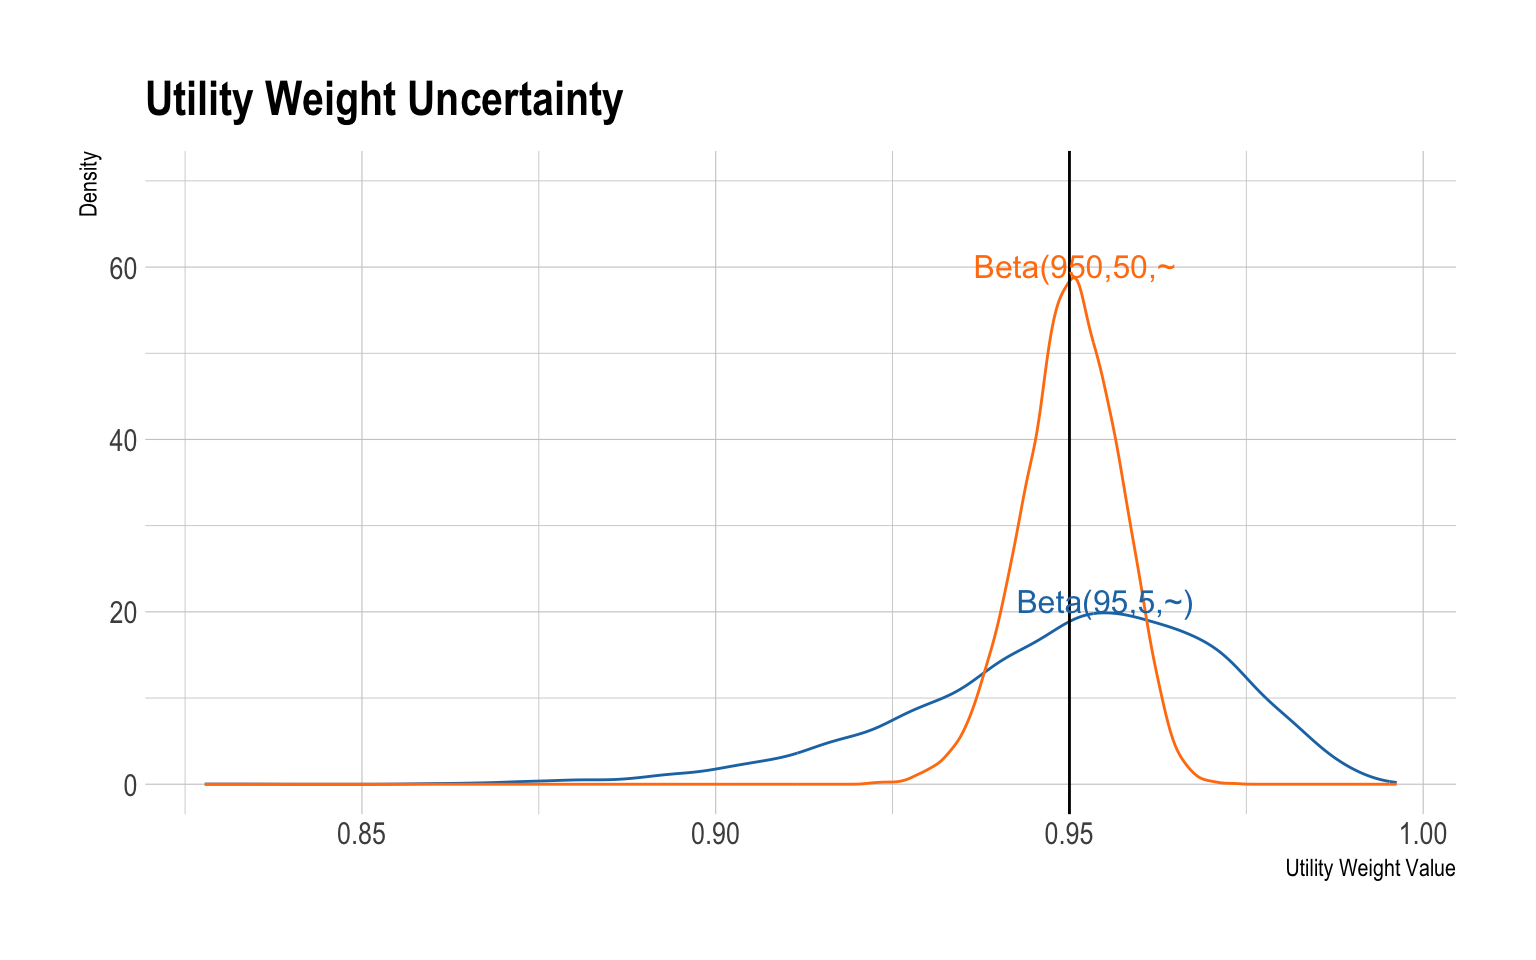
| Utility weight | beta |
| Right skew (e.g., cost) | gamma, lognormal |
| Relative risks or hazard ratios | lognormal |
| Odds Ratio | logistic |
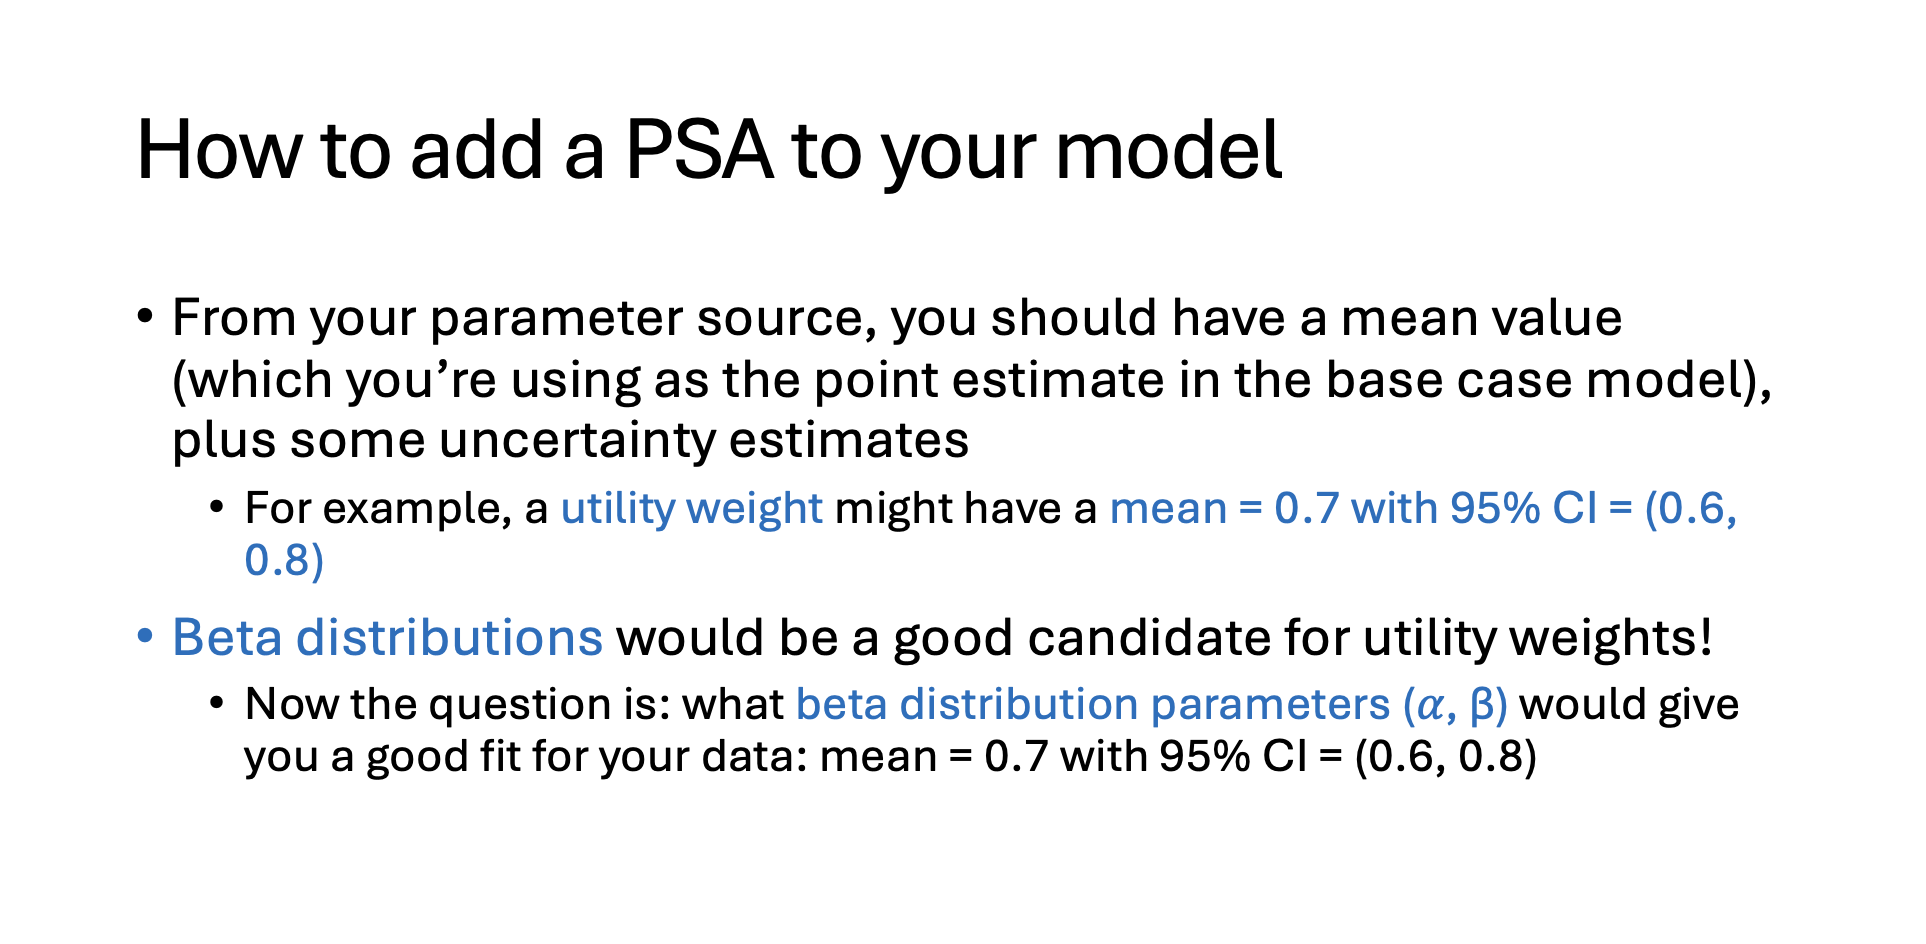
Why do probabilities follow a beta distribution?
- The beta distribution is bounded between 0 and 1, exactly matching the range of probability values.
- Beta(α+successes, β+failures); 20 successes/100 trials = Beta(20, 80)
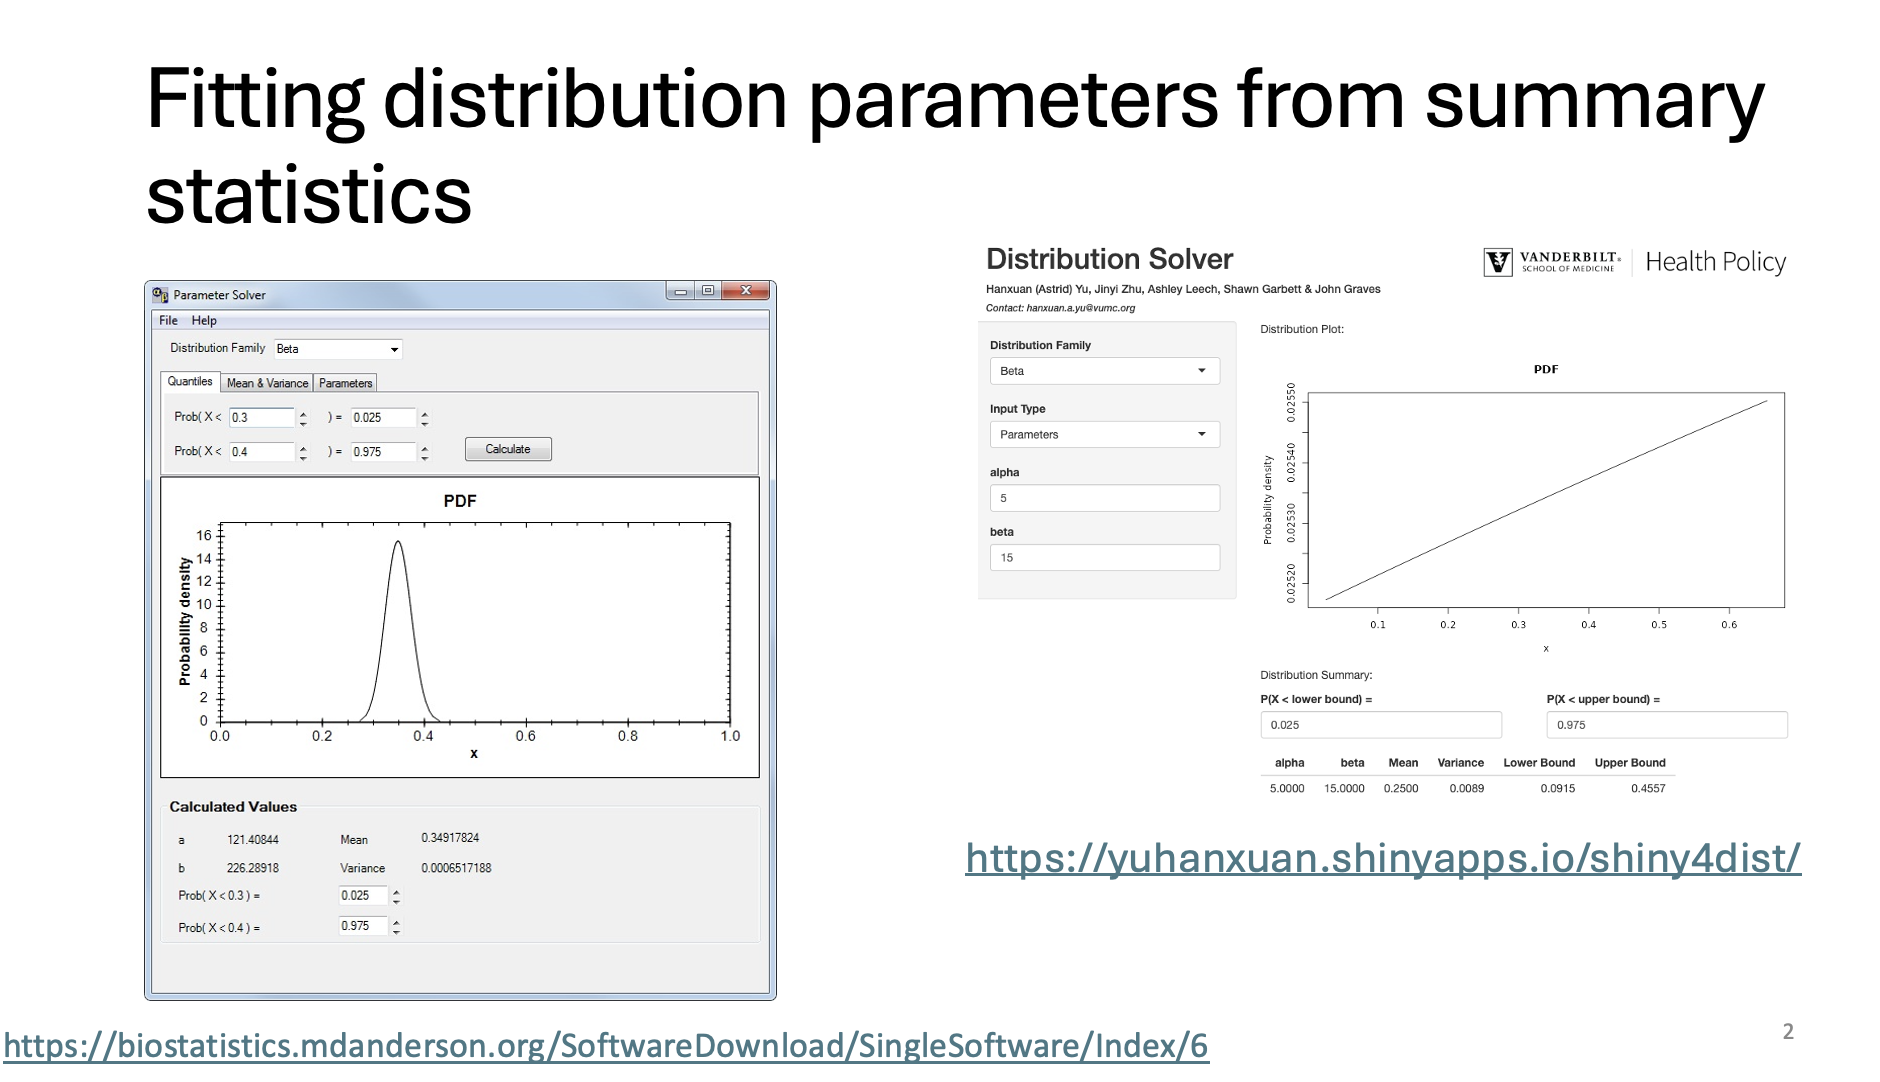
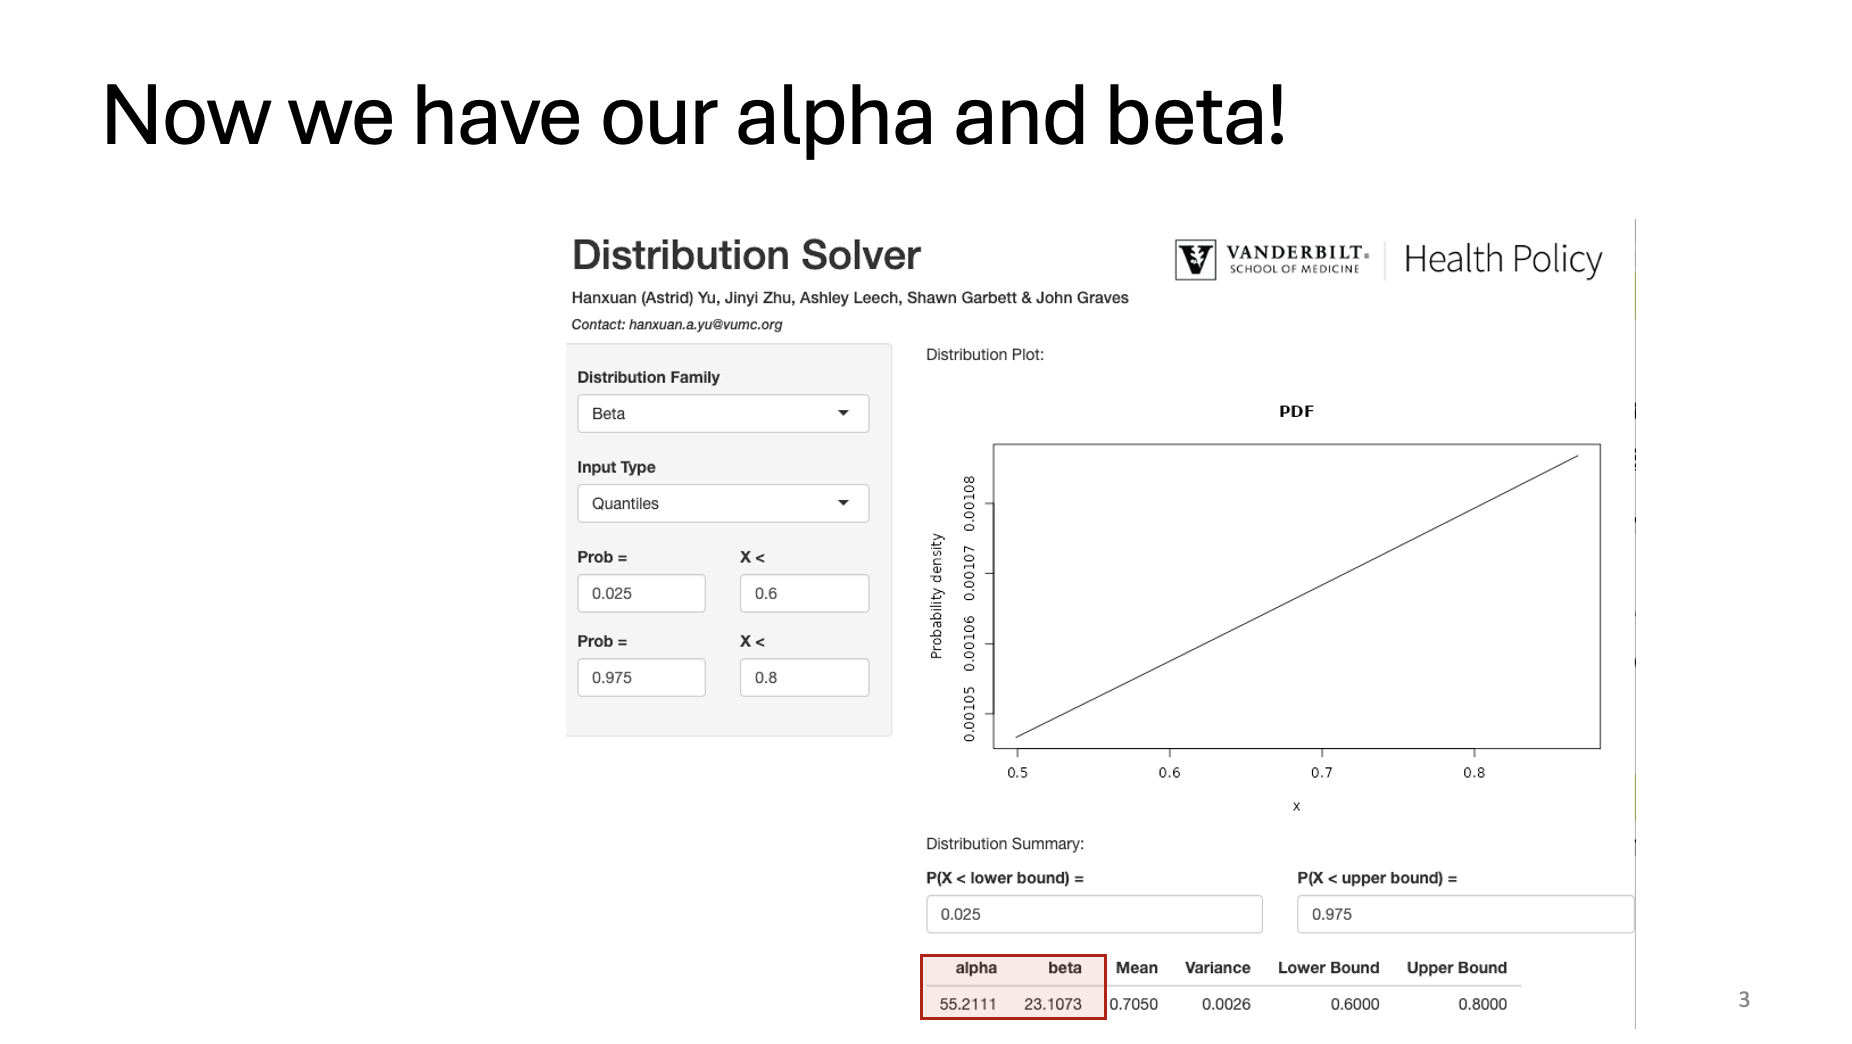
https://yuhanxuan.shinyapps.io/shiny4dist/
97.5% - 2.5% = 95%
So 95% of the probability mass falls between 0.6 and 0.8
For a given iteration j
| Parameter Type | Distribution | Amua |
|---|---|---|
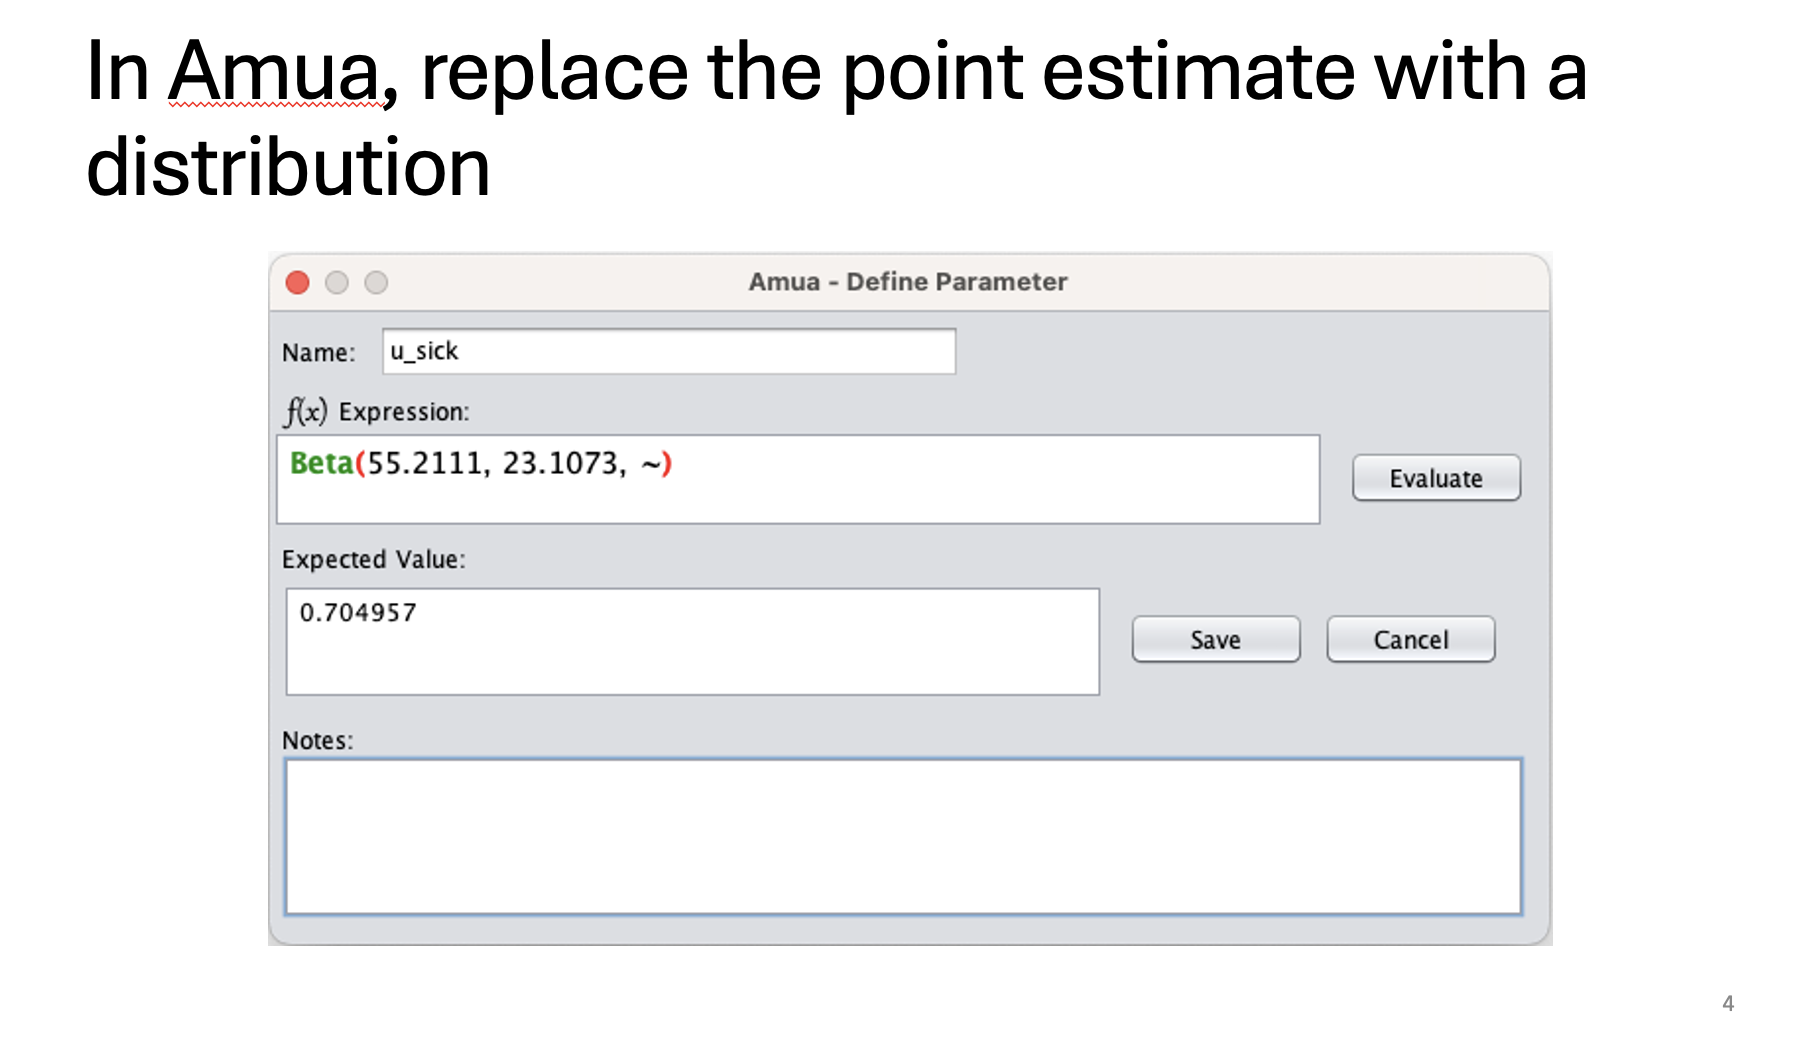
| Probability | beta | Beta(shape1,shape2,~) |
| Rate | gamma | Gamma(shape, scale, ~) |
| Utility weight | beta | Beta(shape1,shape2,~) |
| Right skew (e.g., cost) | gamma, lognormal | LogNorm(shape,scale,~) |
| Relative risks or hazard ratios | lognormal | LogNorm(shape,scale,~) |
| Odds Ratio | logistic | Logistic(location, scale) |
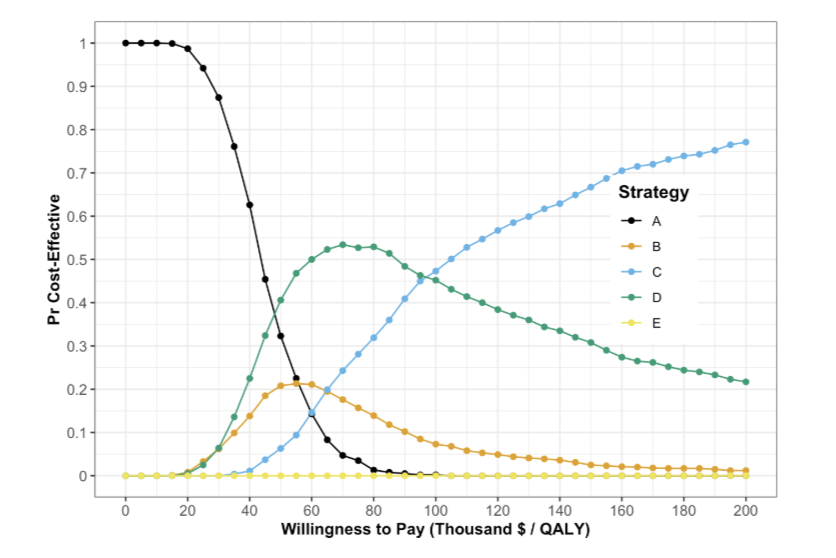
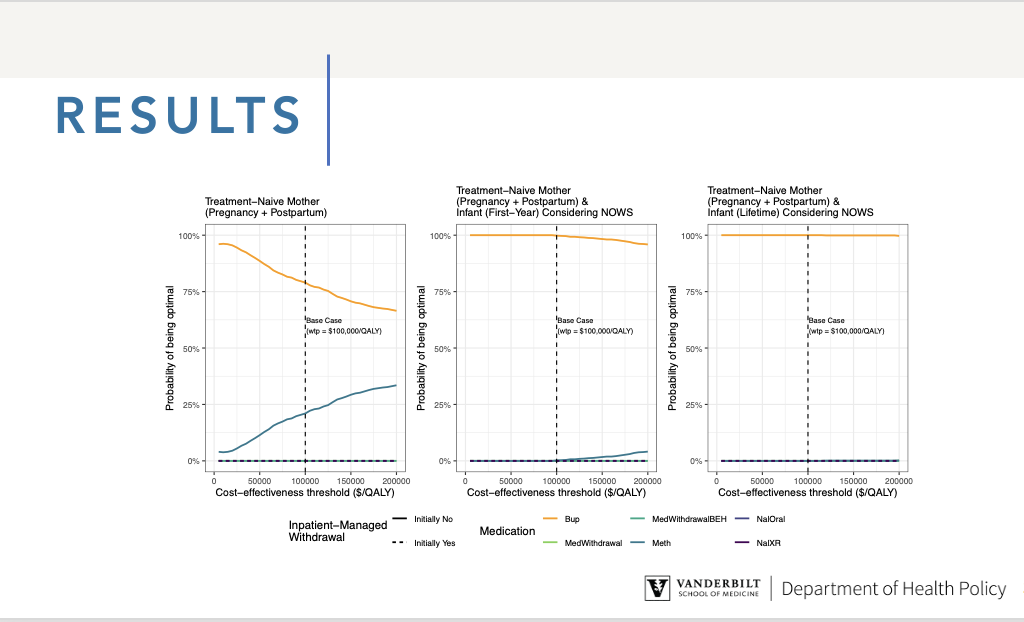
Beta(95,5,~)Beta(950,50,~)CEACs summarize the degree of uncertainty as captured by our PSA.
CEAC represents the (Bayesian) probability of each option being cost-effective at different levels of the cost-effectiveness threshold \lambda.
\lambda = 50000
Net Monetary Benefit
TOTQALY * \lambda - TOTCOST
Net Health Benefit
TOTQALY - \frac{TOTCOST}{\lambda}
| PSA_ID | totcost_trtA | totcost_trtB | totcost_trtC | totcost_trtD | totcost_trtE | totqaly_trtA | totqaly_trtB | totqaly_trtC | totqaly_trtD | totqaly_trtE |
|---|---|---|---|---|---|---|---|---|---|---|
| 1 | 19619.47 | 25588.07 | 37065.38 | 23997.77 | 40797.18 | 18.5372 | 18.6151 | 18.7262 | 18.6529 | 18.6529 |
| 2 | 11776.93 | 17379.42 | 36873.02 | 19453.59 | 45567.65 | 17.0105 | 17.1083 | 17.1966 | 17.1353 | 17.1353 |
| 3 | 13292.49 | 19268.95 | 33789.89 | 19886.42 | 41933.20 | 17.2514 | 17.3591 | 17.5108 | 17.4620 | 17.4620 |
| 4 | 14652.37 | 19102.10 | 25153.63 | 19245.88 | 33977.42 | 16.1276 | 16.1314 | 16.3777 | 16.2537 | 16.2537 |
| 5 | 13286.67 | 15912.61 | 26997.83 | 18687.76 | 39152.52 | 15.9383 | 16.0365 | 16.1411 | 16.0760 | 16.0760 |
| 6 | 14958.85 | 17505.56 | 32929.46 | 20602.67 | 49327.30 | 16.0158 | 16.0886 | 16.2868 | 16.1828 | 16.1828 |
| PSA_ID | NMB_A | NMB_B | NMB_C | NMB_D | NMB_E |
|---|---|---|---|---|---|
| 1 | 907239 | 905168 | 899245 | 908648 | 891849 |
| 2 | 838749 | 838035 | 822957 | 837314 | 811200 |
| 3 | 849279 | 848687 | 841748 | 853212 | 831165 |
| 4 | 791727 | 787466 | 793733 | 793440 | 778708 |
| 5 | 783630 | 785914 | 780057 | 785112 | 764647 |
| 6 | 785829 | 786922 | 781411 | 788536 | 759811 |
| PSA_ID | MAX_IS_A | MAX_IS_B | MAX_IS_C | MAX_IS_D | MAX_IS_E |
|---|---|---|---|---|---|
| 1 | 0 | 0 | 0 | 1 | 0 |
| 2 | 1 | 0 | 0 | 0 | 0 |
| 3 | 0 | 0 | 0 | 1 | 0 |
| 4 | 0 | 0 | 1 | 0 | 0 |
| 5 | 0 | 1 | 0 | 0 | 0 |
| 6 | 0 | 0 | 0 | 1 | 0 |
| lambda | MAX_IS_A | MAX_IS_B | MAX_IS_C | MAX_IS_D | MAX_IS_E |
|---|---|---|---|---|---|
| 50000 | 0.1667 | 0.1667 | 0.1667 | 0.5 | 0 |
| lambda | MAX_IS_A | MAX_IS_B | MAX_IS_C | MAX_IS_D | MAX_IS_E |
|---|---|---|---|---|---|
| 20000 | 1.0000 | 0.0000 | 0.0000 | 0.0000 | 0 |
| 40000 | 0.1667 | 0.1667 | 0.0000 | 0.6667 | 0 |
| 50000 | 0.1667 | 0.1667 | 0.1667 | 0.5000 | 0 |
| 60000 | 0.0000 | 0.3333 | 0.1667 | 0.5000 | 0 |
| 80000 | 0.0000 | 0.0000 | 0.1667 | 0.8333 | 0 |
| 100000 | 0.0000 | 0.0000 | 0.1667 | 0.8333 | 0 |
| 120000 | 0.0000 | 0.0000 | 0.3333 | 0.6667 | 0 |
| 140000 | 0.0000 | 0.0000 | 0.5000 | 0.5000 | 0 |
| 160000 | 0.0000 | 0.0000 | 0.5000 | 0.5000 | 0 |
| 180000 | 0.0000 | 0.0000 | 0.6667 | 0.3333 | 0 |
| 200000 | 0.0000 | 0.0000 | 0.6667 | 0.3333 | 0 |