Review of Day 1 Concepts
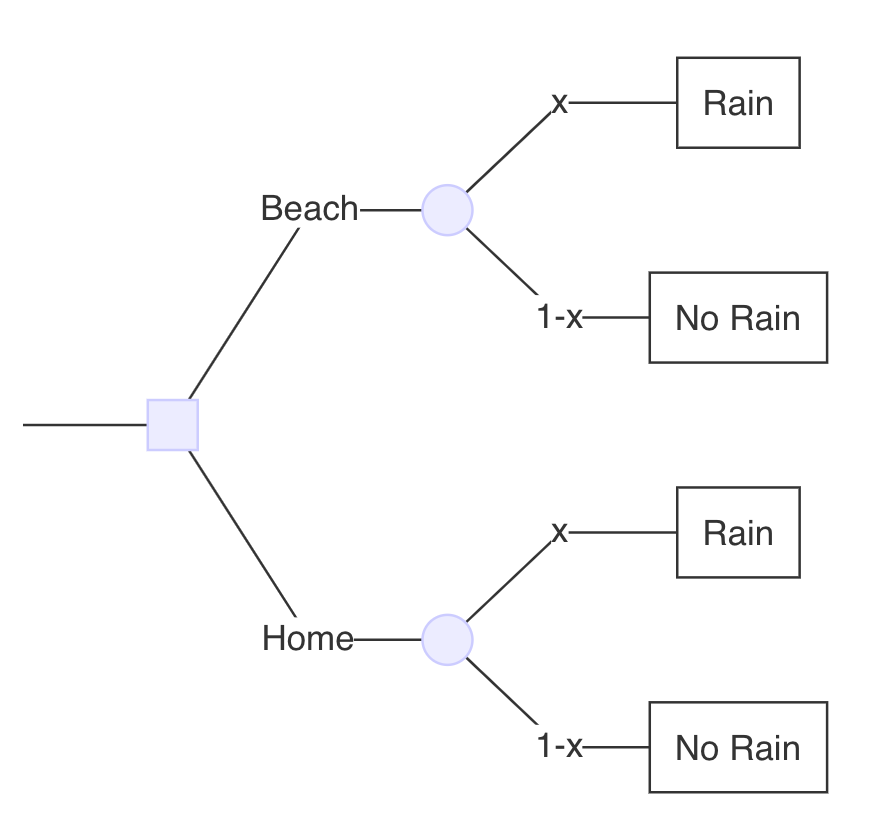
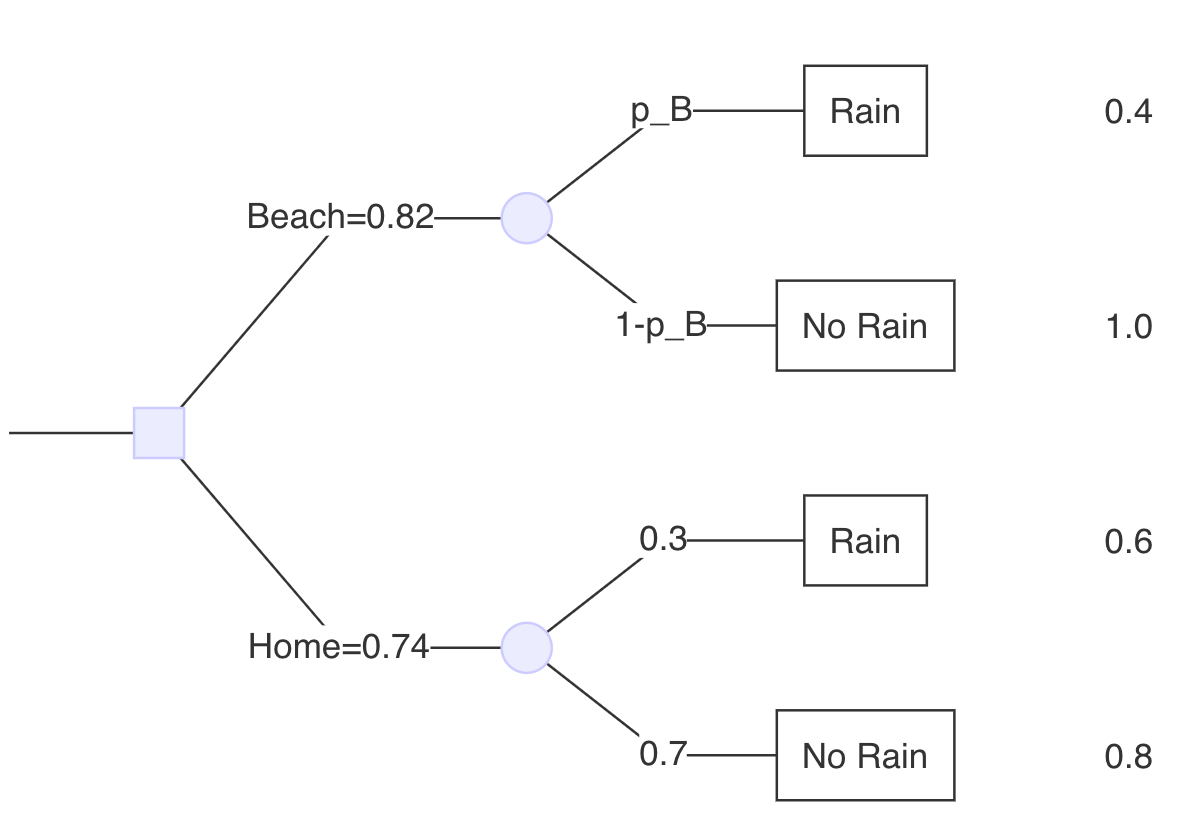
At what probability (p_B) of rain for the beach are you indifferent between the two options?
Decision Tree: Pulmonary Embolism
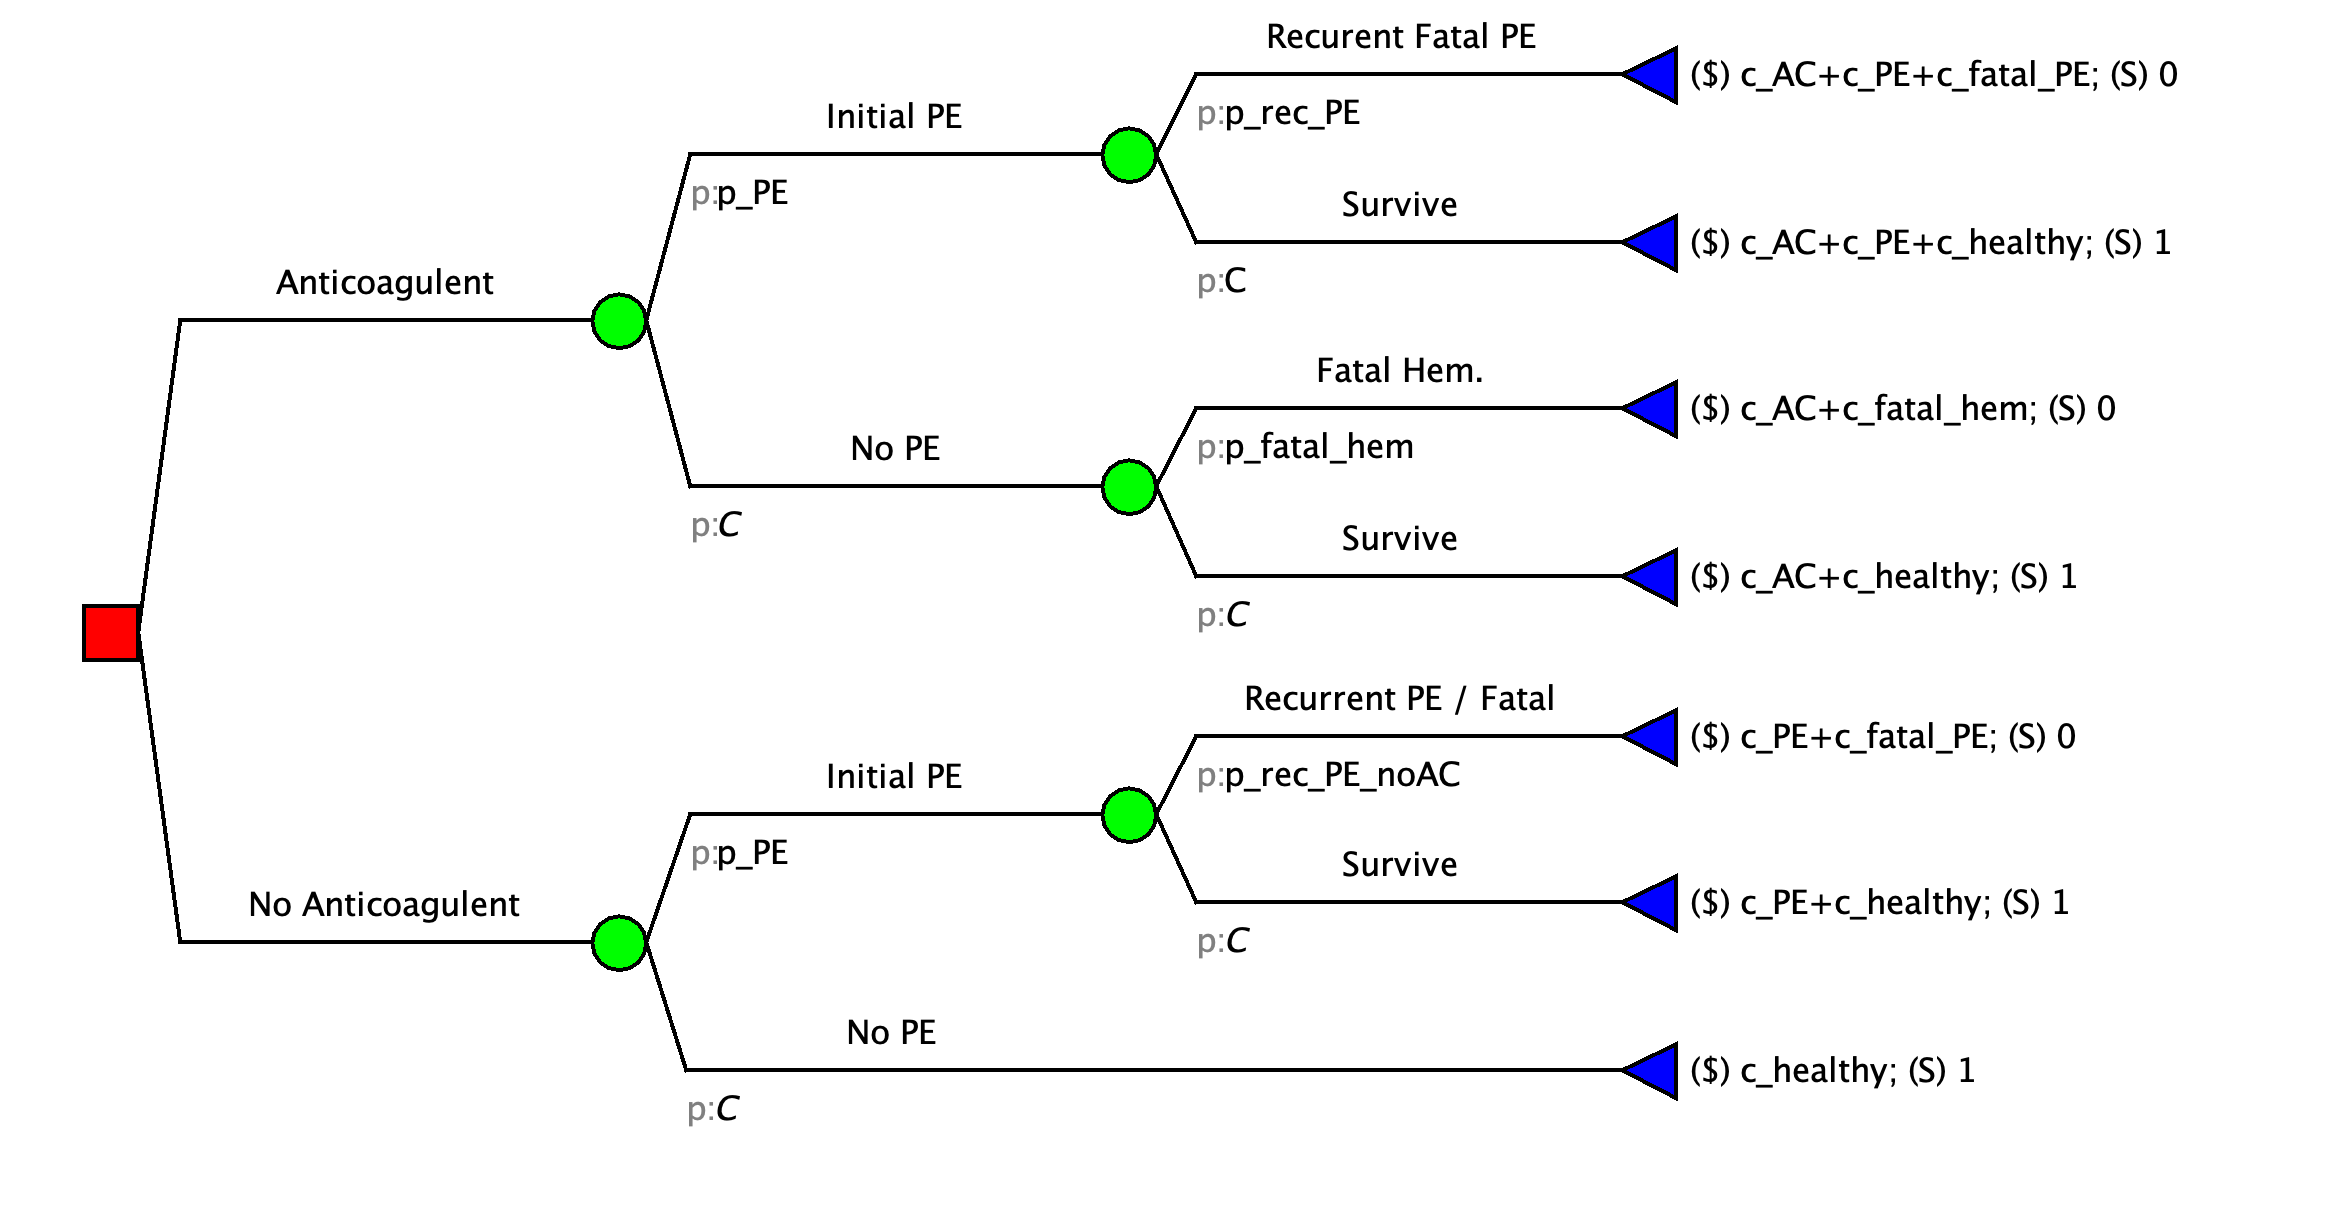
Decision Tree: Pulmonary Embolism
Threshold Analysis
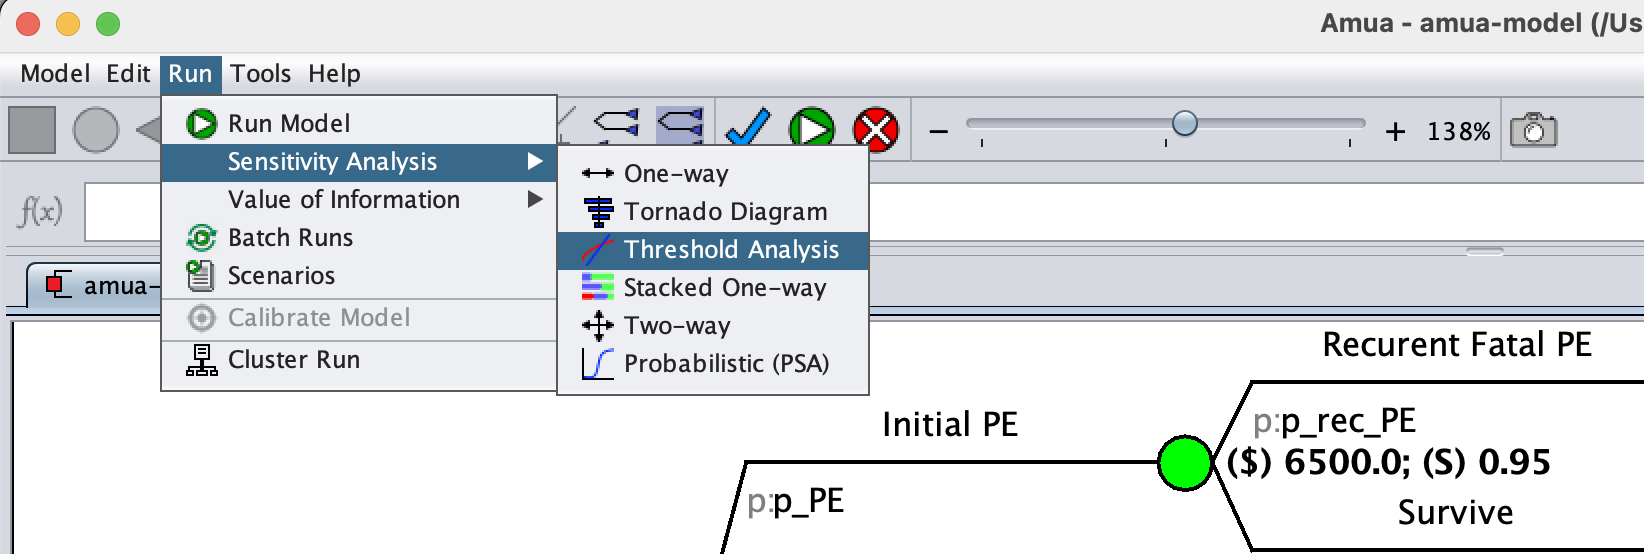
Threshold Analysis
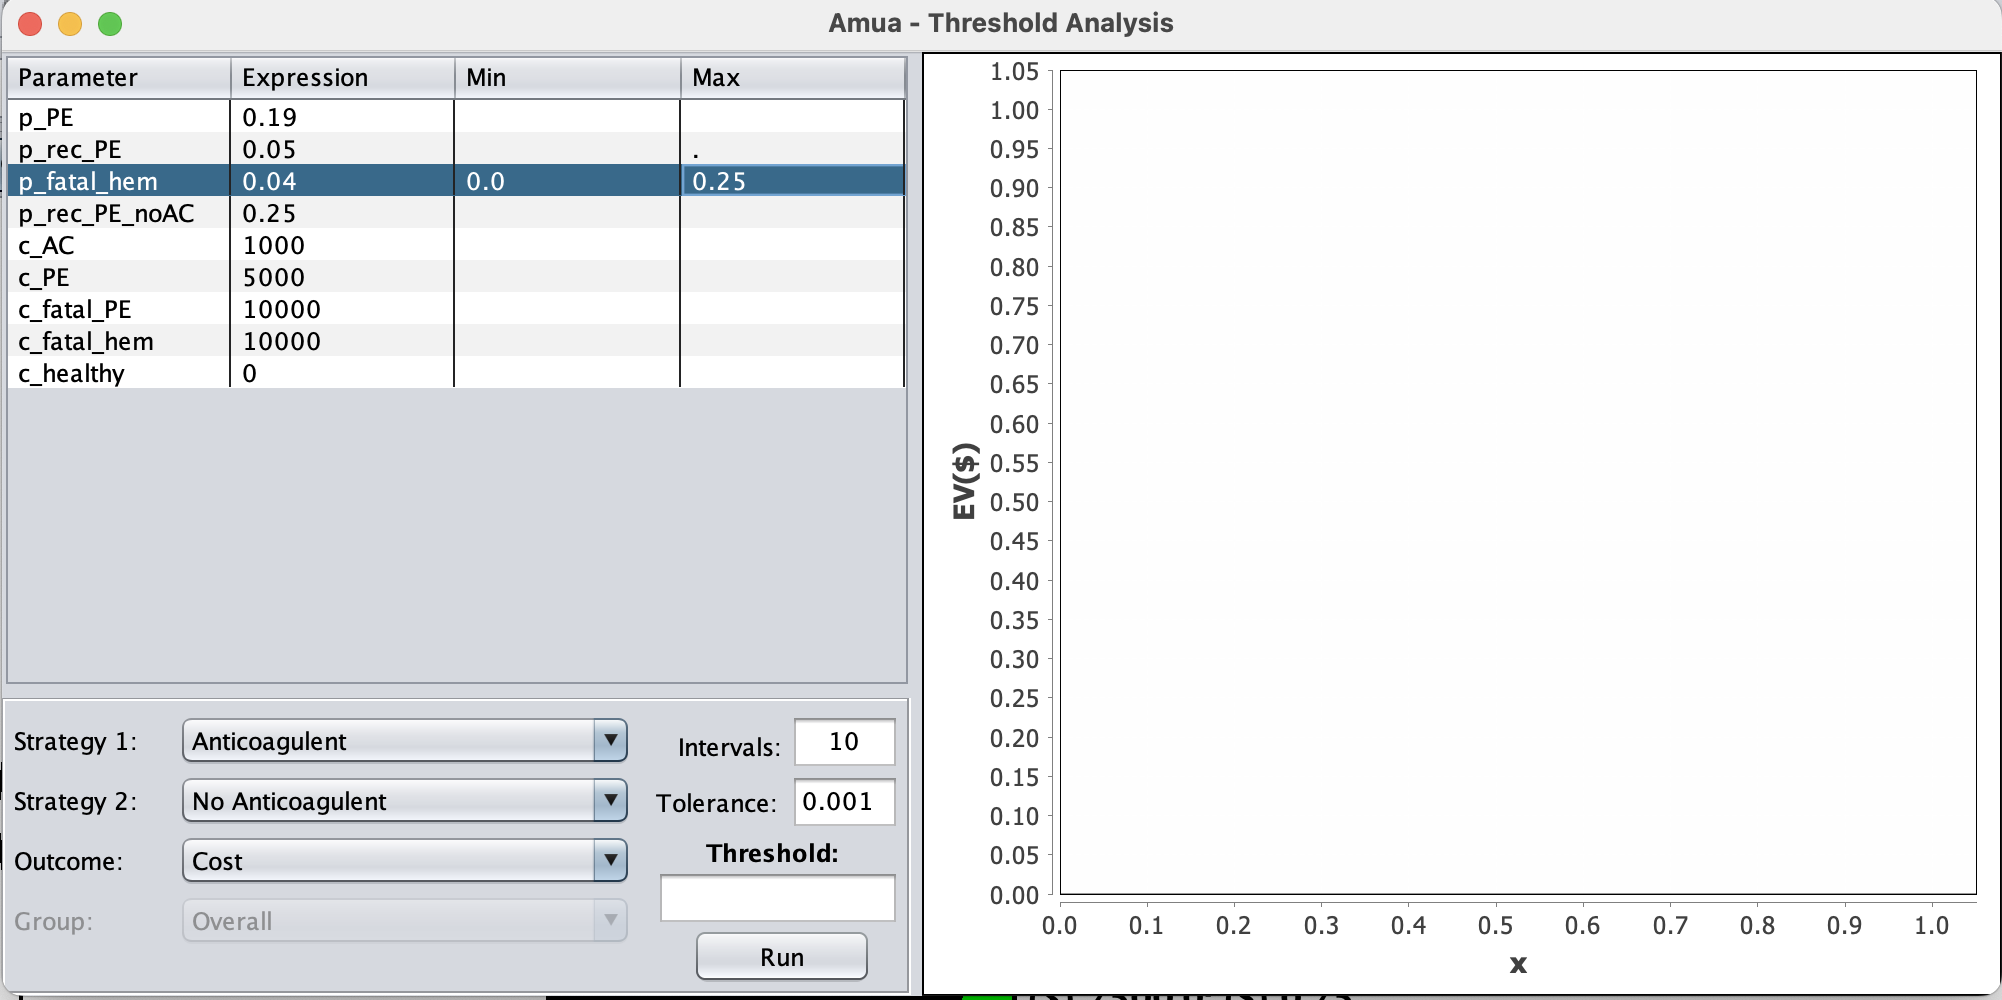
Threshold Analysis
Threshold Analysis
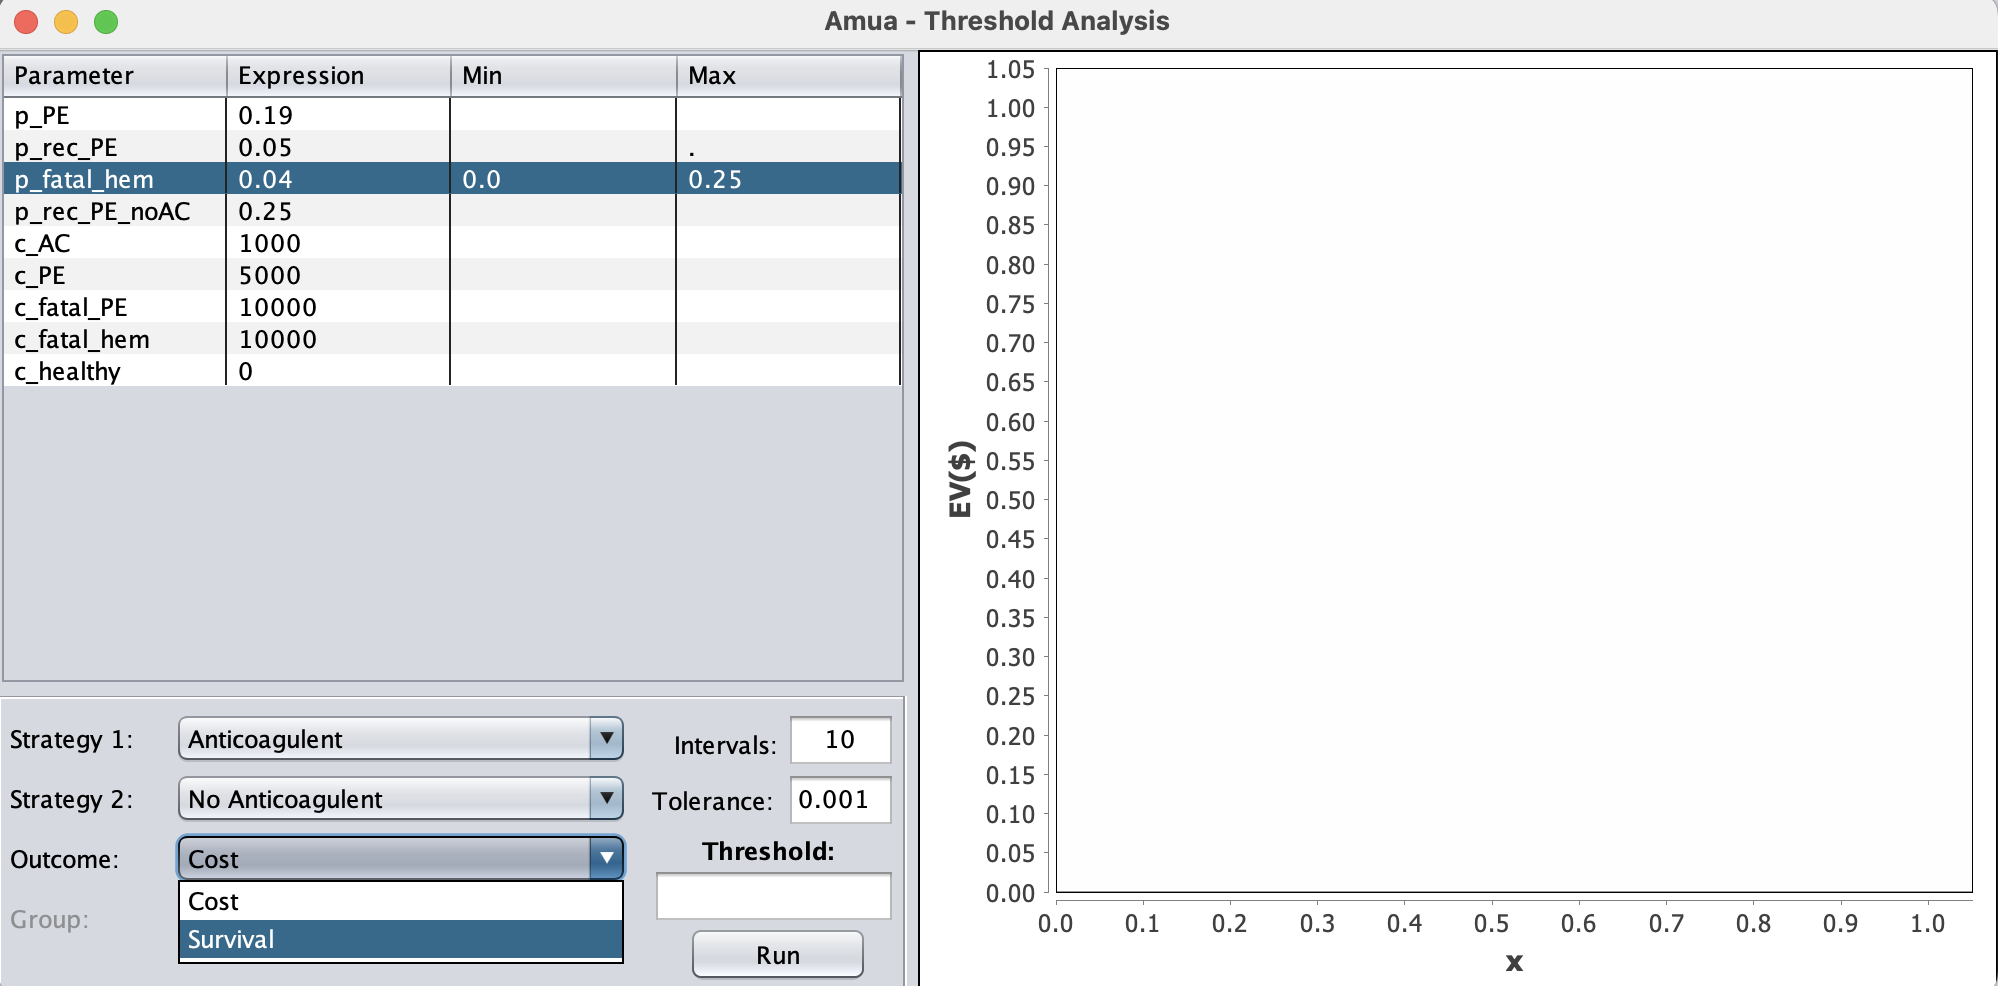
Threshold Analysis
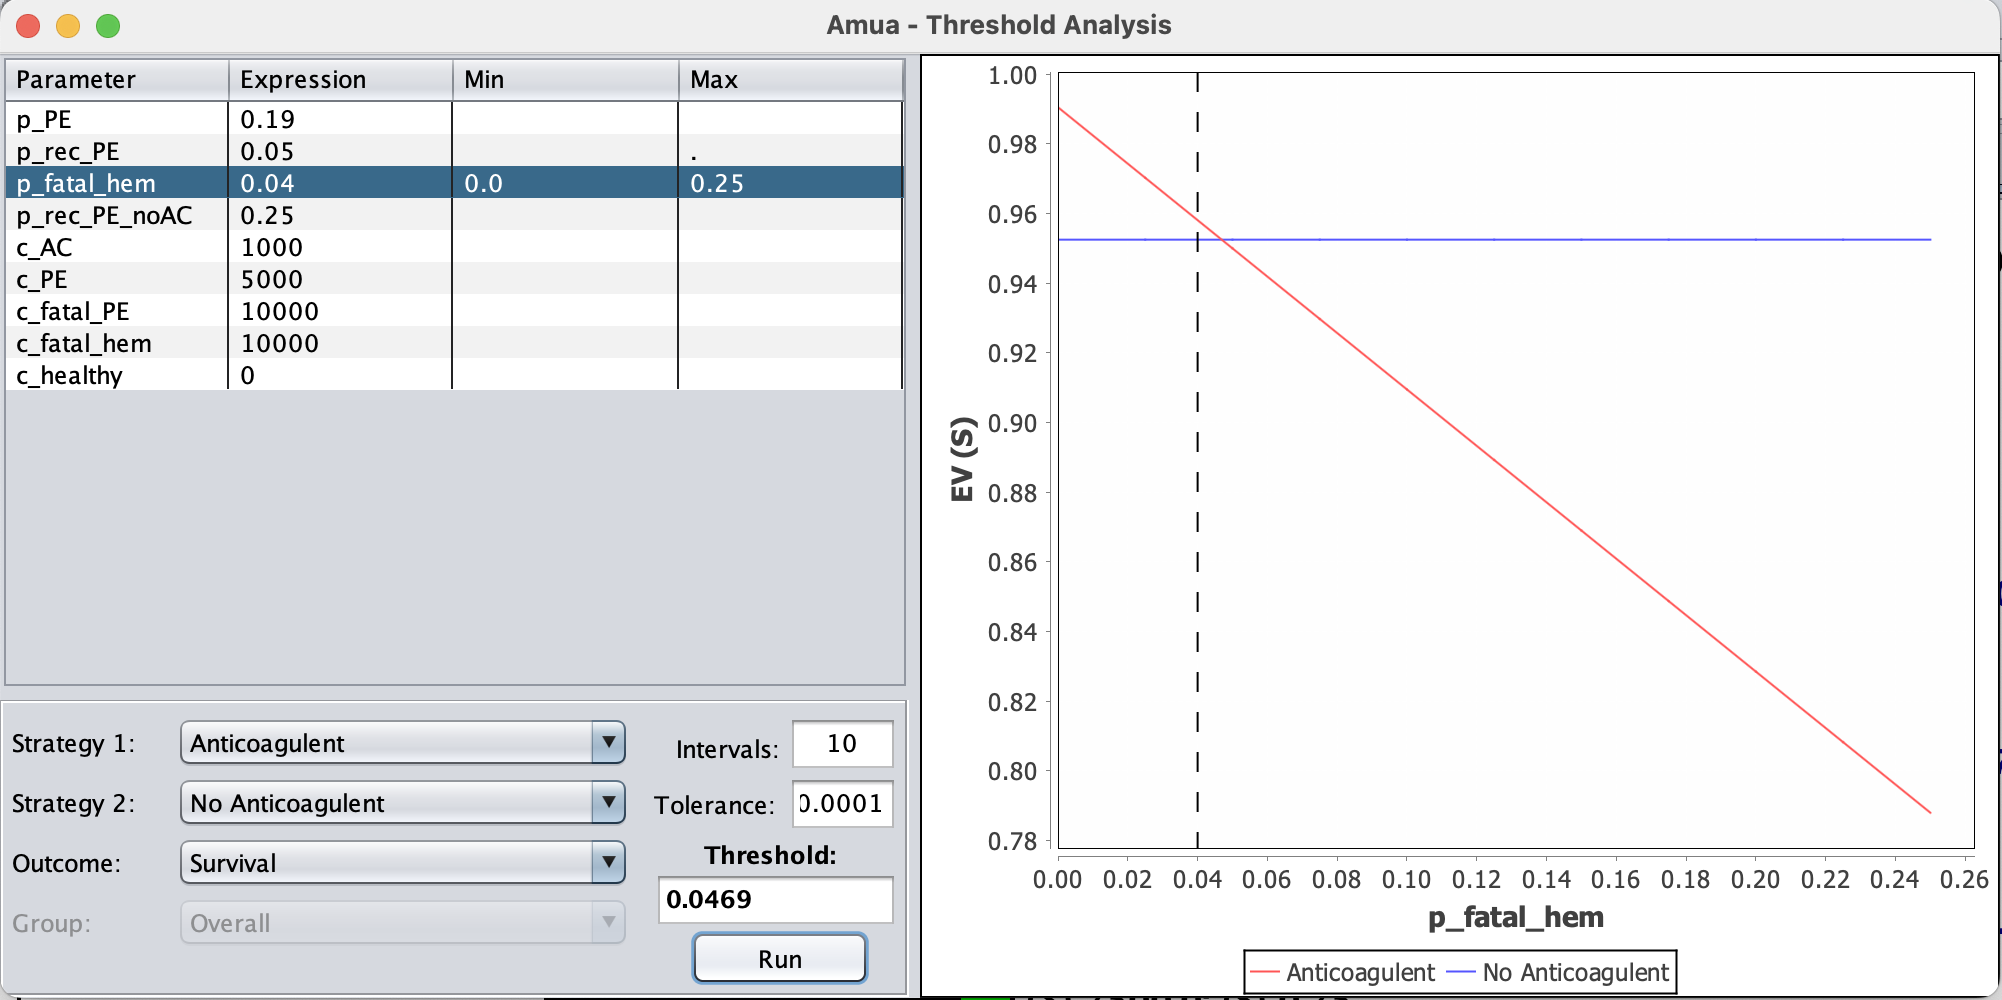
Threshold Analysis
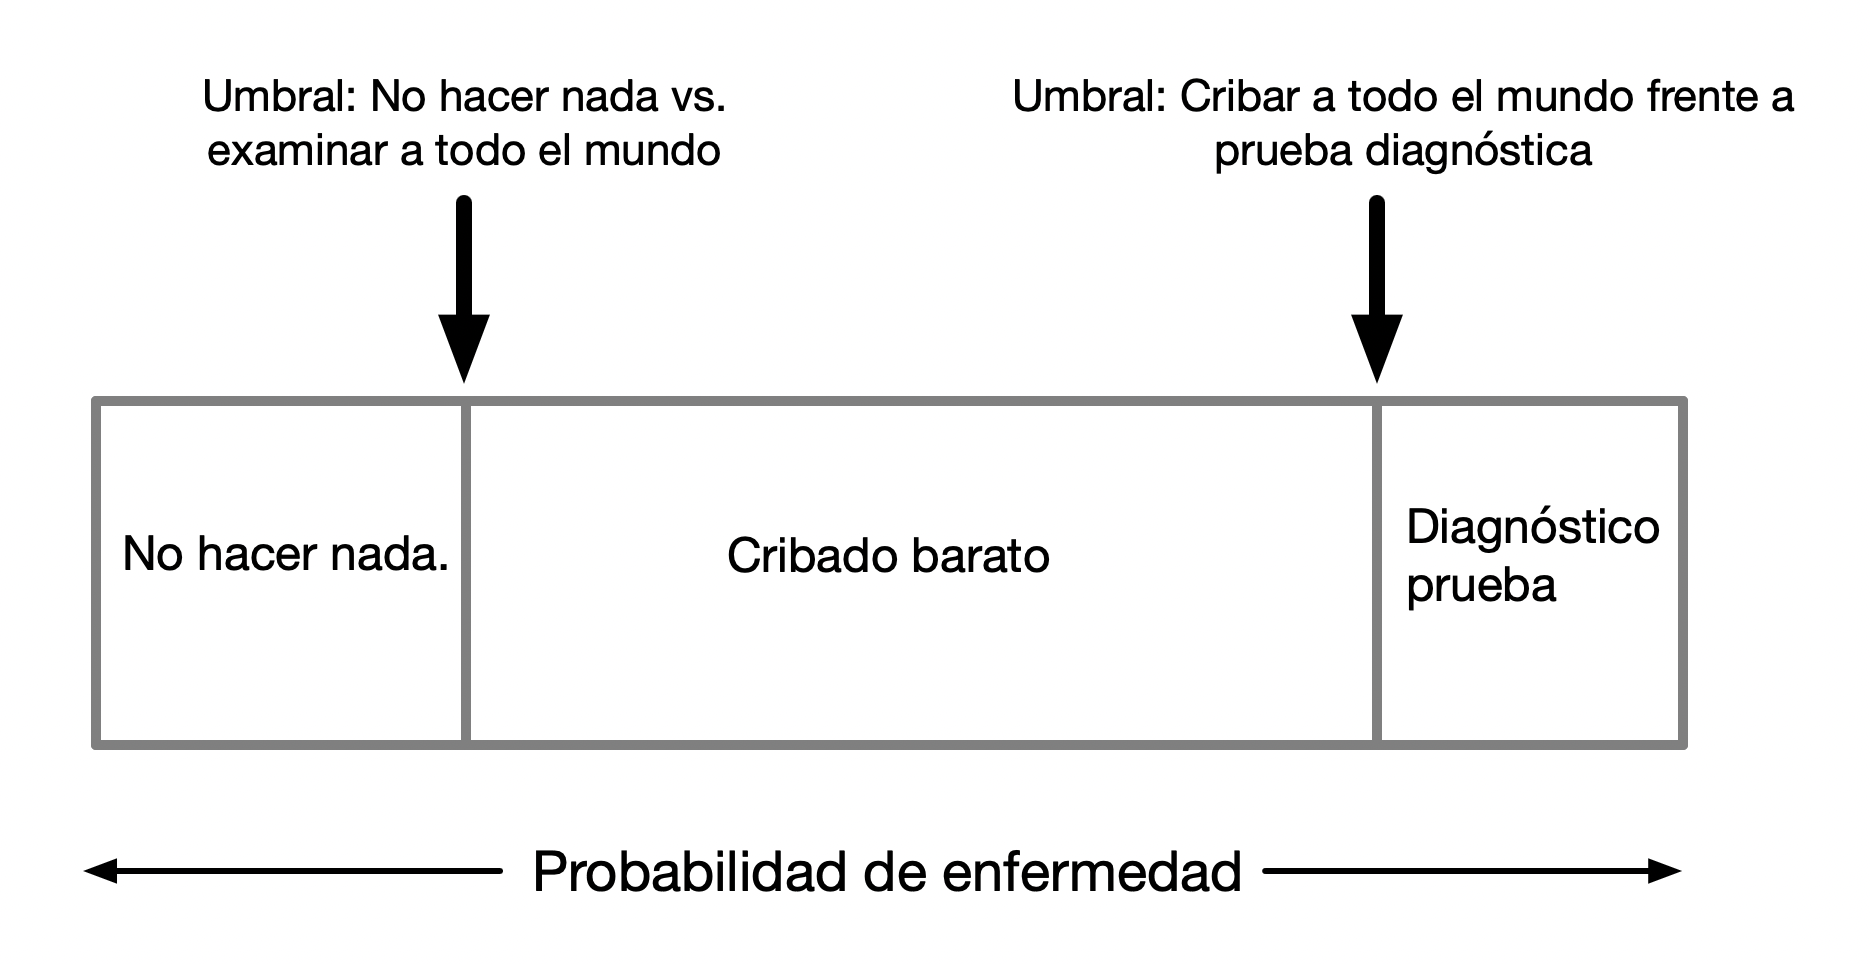
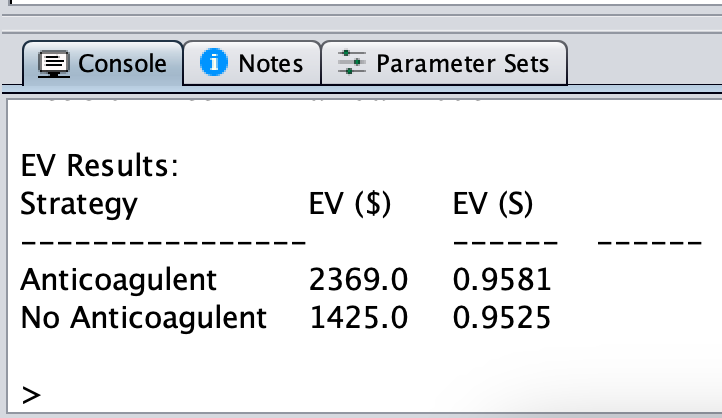
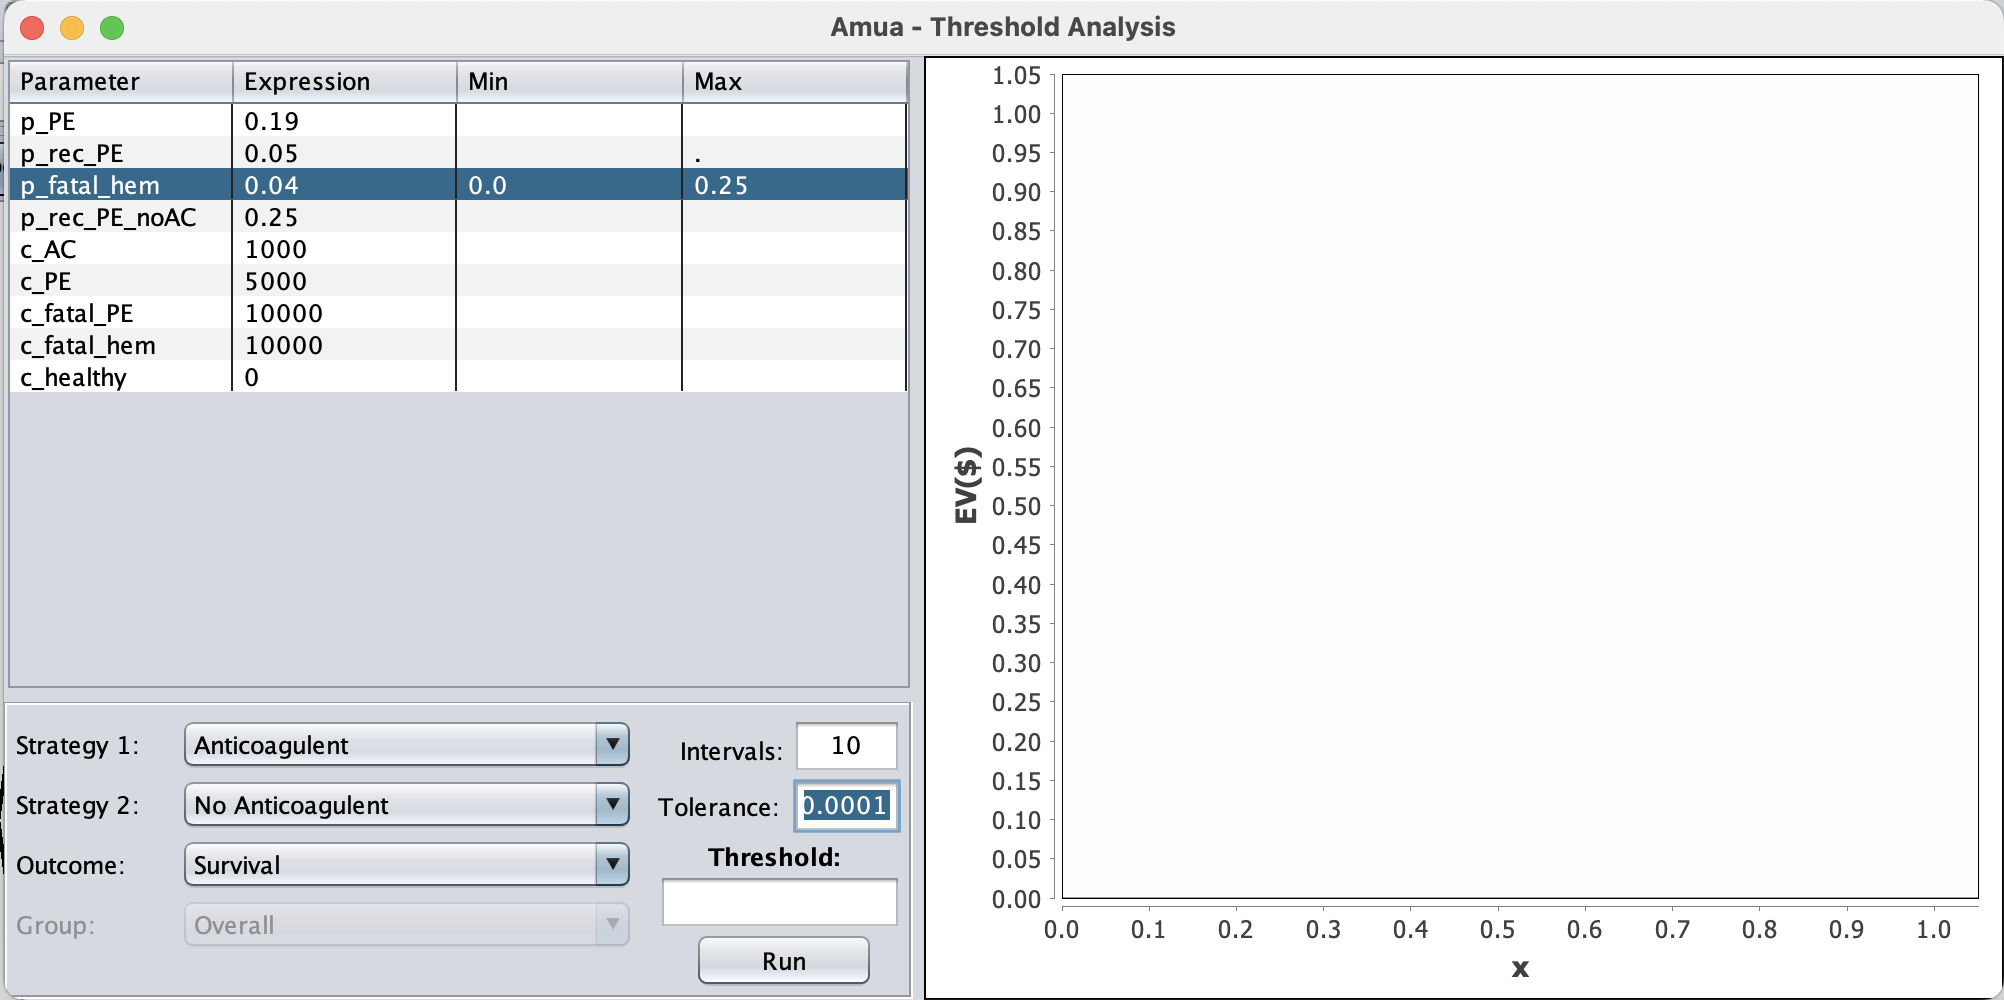
Decision
- We can now solicit expert opinion on a likely range of the disease prevalance.
- If this range falls within the thresholds, we can make a decision despite uncertainty in the underlying disease prevalence.